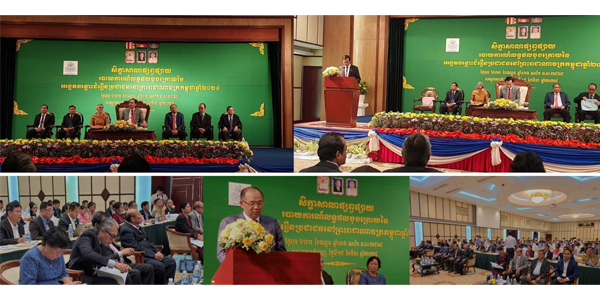
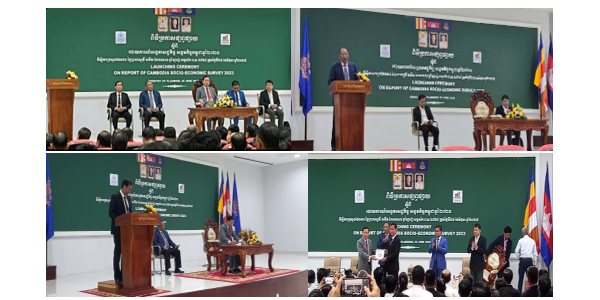
11 Nov 2025 វិទ្យាស្ថានជាតិស្ថិតិ នៃក្រសួងផែនការ បានប្រារព្ធពិធីប្រកាសផ្សព្វផ្សាយរបាយការណ៍ អង្កេតសេដ្ឋកិច្ចសង្គមកម្ពុជាឆ្នាំ ២០២៣ (CSES 2023) Event
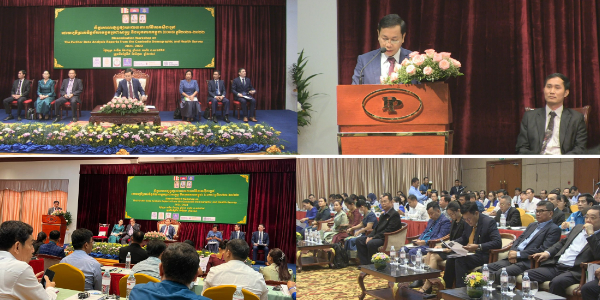
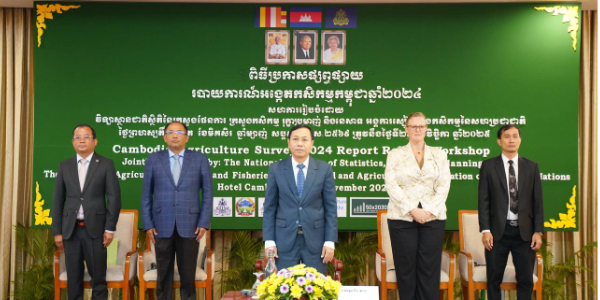
11 Nov 2025 វិទ្យាស្ថានជាតិស្ថិតិ នៃក្រសួងផែនការ បានប្រារព្ធពិធីប្រកាសផ្សព្វផ្សាយរបាយការណ៍ថ្នាក់ជាតិស្តីពីលទ្ធផលចុងក្រោយនៃជំរឿនកសិកម្មនៅព្រះរាជាណាចក្រកម្ពុជា Event
")