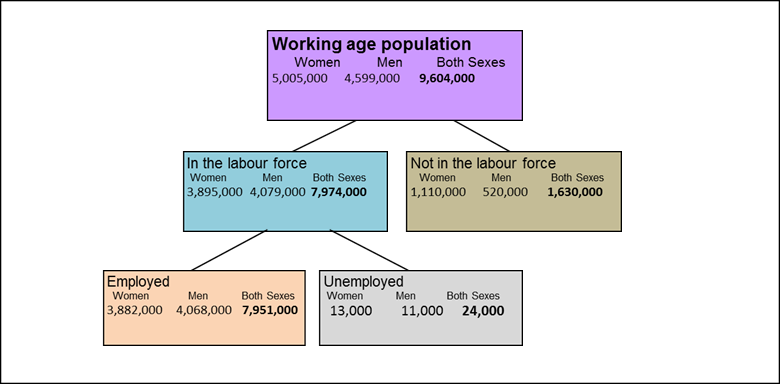
| The labour force in relation to the working age
population( 15-64 year ), 2013 |
|
|
|
|
|
|
|
|
|
|
|
|
|
|
|
|
|
|
|
|
|
|
|
|
|
|
|
|
|
|
|
|
|
|
|
|
|
|
|
|
|
|
|
|
|
|
|
|
|
|
|
|
|
|
|
|
|
|
|
|
|
|
|
|
|
|
|
|
|
|
|
|
|
|
|
|
|
|
|
|
|
|
|
|
|
|
|
|
|
|
|
|
|
|
|
|
|
|
|
|
|
|
|
|
|
|
|
|
|
|
|
|
| 1.
Population and labour force (15-64 years) by sex and geographical domain |
|
| In thousands and
percent. |
|
| Labour force and sex |
2004 |
2007 |
2008 |
2009 |
2010 |
2011 |
2012 |
2013 |
|
| Cambodia |
Phnom Penh |
Other urban |
Other rural |
Cambodia |
Phnom Penh |
Other urban |
Other rural |
Cambodia |
Phnom Penh |
Other urban |
Other rural |
Cambodia |
Phnom Penh |
Other urban |
Other rural |
Cambodia |
Phnom Penh |
Other urban |
Other rural |
Cambodia |
Phnom Penh |
Other urban |
Other rural |
Cambodia |
Phnom Penh |
Other urban |
Other rural |
Cambodia |
Phnom Penh |
Other urban |
Other rural |
|
| Total population |
12,657 |
1,209 |
1,393 |
10,056 |
13,230 |
1,310 |
1,356 |
10,564 |
13,389 |
1,317 |
1,375 |
10,697 |
13,967 |
1,383 |
1,428 |
11,156 |
13,958 |
1,363 |
1,436 |
11,158 |
14,155 |
1,524 |
1,456 |
11,175 |
14,376 |
1,502 |
1,806 |
11,068 |
14,678 |
1,738 |
1,595 |
11,344 |
|
| Total working age
population |
7,589 |
870 |
866 |
5,854 |
8,232 |
963 |
833 |
6,436 |
8,379 |
970 |
893 |
6,516 |
8,865 |
1,001 |
956 |
6,907 |
8,853 |
981 |
946 |
6,926 |
9,038 |
1,111 |
952 |
6,974 |
9,167 |
1,108 |
1,193 |
6,865 |
9,604 |
1,273 |
1,057 |
7,274 |
|
| Labour force |
6,235 |
596 |
680 |
4,959 |
6,888 |
664 |
652 |
5,572 |
6,854 |
671 |
659 |
5,524 |
7,480 |
688 |
737 |
6,055 |
7,702 |
693 |
776 |
6,233 |
7,907 |
775 |
794 |
6,339 |
7,718 |
850 |
955 |
5,913 |
7,974 |
942 |
814 |
6,219 |
|
| Labour force participation
rate |
|
|
|
|
|
|
|
|
|
|
|
|
|
|
|
|
|
|
|
|
|
|
|
|
|
|
|
|
|
|
|
|
|
| Both Sexes |
82.2 |
68.6 |
78.5 |
84.7 |
83.7 |
68.9 |
78.3 |
86.6 |
81.8 |
69.2 |
73.8 |
84.8 |
84.4 |
68.7 |
77.2 |
87.7 |
87.0 |
70.7 |
82.0 |
90.0 |
87.5 |
69.7 |
83.4 |
90.9 |
84.2 |
76.7 |
80.1 |
86.1 |
83.0 |
74.0 |
77.0 |
85.5 |
|
| Women |
77.5 |
63.0 |
75.3 |
80.0 |
78.3 |
61.8 |
72.6 |
81.5 |
75.6 |
61.5 |
65.3 |
79.1 |
80.4 |
61.5 |
72.7 |
84.3 |
84.2 |
64.8 |
79.3 |
87.6 |
84.8 |
62.5 |
79.9 |
89.0 |
79.7 |
71.7 |
75.2 |
81.7 |
77.8 |
67.0 |
73.0 |
80.4 |
|
| Men |
87.4 |
75.1 |
82.1 |
90.1 |
89.6 |
77.1 |
83.7 |
92.2 |
88.8 |
78.1 |
83.3 |
91.1 |
88.8 |
77.2 |
82.1 |
91.3 |
90.0 |
76.9 |
85.3 |
92.5 |
90.4 |
77.4 |
87.2 |
92.9 |
89.1 |
82.3 |
85.2 |
90.8 |
88.7 |
81.7 |
81.1 |
91.1 |
|
| Employment rate |
|
|
|
|
|
|
|
|
|
|
|
|
|
|
|
|
|
|
|
|
|
|
|
|
|
|
|
|
|
|
|
|
|
| Both Sexes |
81.3 |
65.9 |
77.3 |
84.2 |
83.0 |
67.6 |
76.4 |
86.2 |
81.5 |
68.7 |
73.5 |
84.5 |
84.3 |
68.5 |
77.0 |
87.6 |
86.7 |
70.1 |
81.7 |
89.7 |
87.3 |
69.3 |
83.3 |
90.7 |
84.1 |
76.5 |
79.6 |
86.1 |
82.8 |
73.9 |
76.6 |
85.2 |
|
| Women |
76.6 |
59.9 |
74.1 |
79.5 |
77.7 |
60.8 |
70.4 |
81.1 |
75.3 |
61.1 |
64.8 |
78.8 |
80.3 |
61.4 |
72.6 |
84.2 |
84.0 |
64.3 |
78.9 |
87.5 |
84.7 |
62.2 |
79.8 |
88.9 |
79.5 |
71.7 |
74.5 |
81.7 |
77.6 |
66.9 |
72.6 |
80.1 |
|
| Men |
86.6 |
72.9 |
80.8 |
89.5 |
89.0 |
75.5 |
82.1 |
91.9 |
88.5 |
77.3 |
83.2 |
90.9 |
88.6 |
76.9 |
81.7 |
91.2 |
89.6 |
76.4 |
84.8 |
92.2 |
90.2 |
76.8 |
87.1 |
92.7 |
89.0 |
81.9 |
84.9 |
90.8 |
88.5 |
81.6 |
80.8 |
90.8 |
|
| Unemployment rate |
|
|
|
|
|
|
|
|
|
|
|
|
|
|
|
|
|
|
|
|
|
|
|
|
|
|
|
|
|
|
|
|
|
| Both Sexes |
1.0 |
3.9 |
1.6 |
0.6 |
0.7 |
1.9 |
2.5 |
0.4 |
0.4 |
0.8 |
0.5 |
0.3 |
0.1 |
0.3 |
0.3 |
0.1 |
0.3 |
0.8 |
0.5 |
0.3 |
0.2 |
0.6 |
0.1 |
0.2 |
0.2 |
0.2 |
0.6 |
0.1 |
0.3 |
0.1 |
0.5 |
0.3 |
|
| Women |
1.1 |
4.9 |
1.6 |
0.6 |
0.8 |
1.6 |
3.0 |
0.5 |
0.4 |
0.6 |
0.7 |
0.4 |
0.1 |
0.2 |
0.1 |
0.1 |
0.3 |
0.8 |
0.5 |
0.2 |
0.1 |
0.5 |
0.1 |
0.1 |
0.2 |
- |
0.8 |
0.1 |
0.3 |
0.0 |
0.6 |
0.3 |
|
| Men |
1.0 |
2.9 |
1.6 |
0.6 |
0.7 |
2.1 |
2.0 |
0.3 |
0.3 |
1.0 |
0.2 |
0.2 |
0.2 |
0.3 |
0.4 |
0.1 |
0.4 |
0.7 |
0.5 |
0.4 |
0.3 |
0.7 |
0.1 |
0.2 |
0.1 |
0.4 |
0.3 |
0.0 |
0.3 |
0.1 |
0.4 |
0.3 |
|
|
| 2.
Labour force participation rate (15-64 years) by age group and sex |
|
| Percent. |
|
| Age group |
2004 |
2007 |
2008 |
2009 |
2010 |
2011 |
2012 |
2013 |
|
| Women |
Men |
Both Sexes |
Women |
Men |
Both Sexes |
Women |
Men |
Both Sexes |
Women |
Men |
Both Sexes |
Women |
Men |
Both Sexes |
Women |
Men |
Both Sexes |
Women |
Men |
Both Sexes |
Women |
Men |
Both Sexes |
|
| Total (15-64) |
77.5 |
87.4 |
82.2 |
78.3 |
89.6 |
83.7 |
75.6 |
88.8 |
81.8 |
80.4 |
88.8 |
84.4 |
84.2 |
90.0 |
87.0 |
84.8 |
90.4 |
87.5 |
79.7 |
89.1 |
84.2 |
77.8 |
88.7 |
83.0 |
|
| 15-19 |
71.9 |
71.7 |
71.8 |
70.4 |
71.2 |
70.8 |
67.5 |
67.7 |
67.6 |
69.8 |
70.4 |
70.1 |
73.2 |
74.2 |
73.7 |
75.1 |
73.2 |
74.1 |
66.3 |
63.7 |
65.0 |
57.3 |
62.4 |
59.8 |
|
| 20-24 |
79.5 |
86.4 |
82.8 |
80.1 |
88.8 |
84.4 |
74.2 |
89.0 |
81.3 |
79.4 |
86.6 |
82.9 |
83.3 |
86.4 |
84.9 |
82.2 |
85.9 |
84.0 |
79.3 |
86.0 |
82.5 |
79.4 |
86.9 |
83.2 |
|
| 25-34 |
80.8 |
95.0 |
87.7 |
81.4 |
96.5 |
88.9 |
78.7 |
96.6 |
87.6 |
84.3 |
96.4 |
90.1 |
87.4 |
97.1 |
92.2 |
90.0 |
98.5 |
94.2 |
86.1 |
98.4 |
92.2 |
85.1 |
97.4 |
91.1 |
|
| 35-44 |
82.5 |
96.0 |
88.7 |
84.5 |
97.1 |
90.5 |
83.4 |
96.7 |
89.5 |
87.1 |
97.7 |
92.1 |
91.2 |
98.2 |
94.5 |
91.4 |
98.3 |
94.6 |
89.8 |
98.6 |
94.1 |
87.7 |
99.0 |
93.0 |
|
| 45-54 |
79.5 |
93.5 |
85.3 |
80.9 |
96.3 |
87.5 |
79.2 |
97.1 |
87.1 |
85.1 |
95.9 |
89.9 |
88.7 |
96.7 |
92.2 |
86.7 |
95.2 |
90.6 |
82.3 |
95.9 |
88.4 |
80.8 |
95.3 |
87.5 |
|
| 55-64 |
63.4 |
83.2 |
71.7 |
68.1 |
88.1 |
76.6 |
65.3 |
85.4 |
73.8 |
71.3 |
86.1 |
77.6 |
77.2 |
87.4 |
81.4 |
78.0 |
89.9 |
83.0 |
65.3 |
89.1 |
75.0 |
67.7 |
87.0 |
75.3 |
|
| Of which 15-24 |
75.5 |
78.4 |
76.9 |
74.8 |
79.3 |
77.0 |
70.6 |
77.2 |
73.8 |
74.4 |
77.7 |
76.1 |
77.8 |
79.5 |
78.7 |
78.4 |
78.8 |
78.6 |
72.6 |
74.0 |
73.3 |
68.6 |
75.0 |
71.8 |
|
|
| 3.
Labour force participation rate (15-64 years) by age group and geographical
domain |
|
| Percent. |
|
| Age group |
2004 |
2007 |
2008 |
2009 |
2010 |
2011 |
2012 |
2013 |
|
| Cambodia |
Phnom Penh |
Other urban |
Other rural |
Cambodia |
Phnom Penh |
Other urban |
Other rural |
Cambodia |
Phnom Penh |
Other urban |
Other rural |
Cambodia |
Phnom Penh |
Other urban |
Other rural |
Cambodia |
Phnom Penh |
Other urban |
Other rural |
Cambodia |
Phnom Penh |
Other urban |
Other rural |
Cambodia |
Phnom Penh |
Other urban |
Other rural |
Cambodia |
Phnom Penh |
Other urban |
Other rural |
|
| Total (15-64) |
82.2 |
68.6 |
78.5 |
84.7 |
83.7 |
68.9 |
78.3 |
86.6 |
81.8 |
69.2 |
73.8 |
84.8 |
84.4 |
68.7 |
77.2 |
87.7 |
87.0 |
70.7 |
82.0 |
90.0 |
87.5 |
69.7 |
83.4 |
90.9 |
84.2 |
76.7 |
80.1 |
86.1 |
83.0 |
74.0 |
77.0 |
85.5 |
|
| 15-19 |
71.8 |
38.1 |
58.4 |
78.4 |
70.8 |
31.3 |
54.0 |
77.9 |
67.6 |
32.2 |
51.2 |
74.4 |
70.1 |
34.3 |
53.3 |
76.4 |
73.7 |
33.8 |
58.1 |
80.0 |
74.1 |
33.1 |
56.5 |
81.9 |
65.0 |
39.5 |
54.1 |
70.0 |
59.8 |
25.3 |
41.4 |
67.1 |
|
| 20-24 |
82.8 |
69.4 |
81.4 |
85.5 |
84.4 |
67.1 |
77.2 |
88.1 |
81.3 |
67.3 |
71.4 |
85.1 |
82.9 |
63.5 |
73.4 |
87.3 |
84.9 |
64.9 |
77.6 |
89.2 |
84.0 |
65.3 |
79.5 |
87.8 |
82.5 |
72.7 |
75.6 |
85.3 |
83.2 |
73.3 |
75.2 |
86.0 |
|
| 25-34 |
87.7 |
83.3 |
85.1 |
88.7 |
88.9 |
79.9 |
86.7 |
90.4 |
87.6 |
83.3 |
83.1 |
88.8 |
90.1 |
81.0 |
85.3 |
92.2 |
92.2 |
84.0 |
90.0 |
93.9 |
94.2 |
87.4 |
93.1 |
95.6 |
92.2 |
91.4 |
91.0 |
92.6 |
91.1 |
89.5 |
85.9 |
92.2 |
|
| 35-44 |
88.7 |
83.6 |
90.8 |
89.0 |
90.5 |
82.6 |
91.8 |
91.4 |
89.5 |
85.1 |
82.2 |
91.1 |
92.1 |
83.8 |
89.5 |
93.7 |
94.5 |
86.1 |
92.8 |
95.8 |
94.6 |
85.6 |
93.3 |
96.3 |
94.1 |
90.4 |
90.7 |
95.4 |
93.0 |
88.6 |
90.7 |
94.1 |
|
| 45-54 |
85.3 |
79.1 |
84.4 |
86.6 |
87.5 |
81.2 |
89.4 |
88.4 |
87.1 |
77.8 |
88.9 |
88.4 |
89.9 |
77.7 |
88.1 |
91.9 |
92.2 |
79.2 |
92.8 |
93.7 |
90.6 |
72.4 |
92.1 |
93.1 |
88.4 |
77.8 |
87.4 |
90.4 |
87.5 |
79.5 |
86.4 |
89.2 |
|
| 55-64 |
71.7 |
49.0 |
73.2 |
75.0 |
76.6 |
64.2 |
68.7 |
79.7 |
73.8 |
53.0 |
64.7 |
77.8 |
77.6 |
58.5 |
70.3 |
81.8 |
81.4 |
59.1 |
77.6 |
85.0 |
83.0 |
50.8 |
78.5 |
88.1 |
75.0 |
61.1 |
72.5 |
77.4 |
75.3 |
63.3 |
72.6 |
77.9 |
|
| Of which 15-24 |
76.9 |
55.0 |
68.4 |
81.6 |
77.0 |
50.6 |
63.2 |
82.6 |
73.8 |
49.9 |
60.2 |
79.2 |
76.1 |
50.0 |
62.6 |
81.4 |
78.7 |
50.7 |
66.8 |
84.0 |
78.6 |
49.4 |
67.0 |
84.5 |
73.3 |
57.0 |
64.3 |
77.1 |
71.8 |
51.7 |
59.4 |
76.6 |
|
|
| 4.
Labour force participation rate (15-64 years) by age group, geographical
domain and sex, |
|
| Percent. |
|
| Age group |
2004 |
2007 |
2008 |
2009 |
2010 |
2011 |
2012 |
2013 |
|
| Cambodia |
Phnom Penh |
Other urban |
Other rural |
Cambodia |
Phnom Penh |
Other urban |
Other rural |
Cambodia |
Phnom Penh |
Other urban |
Other rural |
Cambodia |
Phnom Penh |
Other urban |
Other rural |
Cambodia |
Phnom Penh |
Other urban |
Other rural |
Cambodia |
Phnom Penh |
Other urban |
Other rural |
Cambodia |
Phnom Penh |
Other urban |
Other rural |
Cambodia |
Phnom Penh |
Other urban |
Other rural |
|
| Women |
Men |
Women |
Men |
Women |
Men |
Women |
Men |
Women |
Men |
Women |
Men |
Women |
Men |
Women |
Men |
Women |
Men |
Women |
Men |
Women |
Men |
Women |
Men |
Women |
Men |
Women |
Men |
Women |
Men |
Women |
Men |
Women |
Men |
Women |
Men |
Women |
Men |
Women |
Men |
Women |
Men |
Women |
Men |
Women |
Men |
Women |
Men |
Women |
Men |
Women |
Men |
Women |
Men |
Women |
Men |
Women |
Men |
Women |
Men |
Women |
Men |
Women |
Men |
|
| Total (15-64) |
77.5 |
87.4 |
63.0 |
75.1 |
75.3 |
82.1 |
80.0 |
90.1 |
78.3 |
89.6 |
61.8 |
77.1 |
72.6 |
83.7 |
81.5 |
92.2 |
75.6 |
88.8 |
61.5 |
78.1 |
65.3 |
83.3 |
79.1 |
91.1 |
80.4 |
88.8 |
61.5 |
77.2 |
72.7 |
82.1 |
84.3 |
91.3 |
84.2 |
90.0 |
64.8 |
76.9 |
79.3 |
85.3 |
87.6 |
92.5 |
84.8 |
90.4 |
62.5 |
77.4 |
79.9 |
87.2 |
89.0 |
92.9 |
79.7 |
89.1 |
71.7 |
82.3 |
75.2 |
85.2 |
81.7 |
90.8 |
77.8 |
88.7 |
67.0 |
81.7 |
73.0 |
81.1 |
80.4 |
91.1 |
|
| 15-19 |
71.9 |
71.7 |
41.5 |
34.1 |
62.5 |
54.6 |
77.8 |
78.9 |
70.4 |
71.2 |
36.1 |
25.9 |
53.4 |
54.6 |
76.8 |
79.1 |
67.5 |
67.7 |
36.5 |
26.3 |
50.4 |
52.1 |
74.6 |
74.3 |
69.8 |
70.4 |
40.6 |
27.2 |
57.1 |
49.8 |
75.3 |
77.4 |
73.2 |
74.2 |
42.5 |
25.4 |
62.5 |
52.8 |
78.2 |
81.6 |
75.1 |
73.2 |
37.0 |
29.6 |
57.8 |
54.9 |
82.5 |
81.2 |
66.3 |
63.7 |
43.0 |
36.5 |
56.9 |
51.6 |
70.5 |
69.4 |
57.3 |
62.4 |
26.4 |
24.2 |
48.1 |
35.4 |
62.9 |
71.3 |
|
| 20-24 |
79.5 |
86.4 |
73.1 |
65.3 |
81.5 |
81.3 |
80.4 |
90.8 |
80.1 |
88.8 |
68.1 |
65.9 |
71.1 |
81.9 |
83.2 |
93.2 |
74.2 |
89.0 |
69.1 |
65.0 |
62.3 |
83.4 |
77.0 |
93.3 |
79.4 |
86.6 |
64.1 |
62.8 |
70.4 |
76.9 |
83.5 |
91.1 |
83.3 |
86.4 |
68.7 |
60.7 |
76.4 |
79.0 |
87.0 |
91.4 |
82.2 |
85.9 |
68.5 |
61.9 |
77.4 |
81.4 |
85.2 |
90.5 |
79.3 |
86.0 |
75.3 |
69.3 |
76.0 |
75.2 |
80.5 |
90.3 |
79.4 |
86.9 |
74.9 |
71.4 |
77.9 |
72.7 |
80.4 |
91.3 |
|
| 25-34 |
80.8 |
95.0 |
75.3 |
91.9 |
78.2 |
92.5 |
82.0 |
95.8 |
81.4 |
96.5 |
68.7 |
92.1 |
80.0 |
93.0 |
83.4 |
97.5 |
78.7 |
96.6 |
73.2 |
94.0 |
70.2 |
96.8 |
80.7 |
97.0 |
84.3 |
96.4 |
71.0 |
93.1 |
79.3 |
92.2 |
87.3 |
97.4 |
87.4 |
97.1 |
75.7 |
92.5 |
83.6 |
97.2 |
90.1 |
97.9 |
90.0 |
98.5 |
79.8 |
95.8 |
87.8 |
98.9 |
92.2 |
98.9 |
86.1 |
98.4 |
85.5 |
98.1 |
82.7 |
99.7 |
86.7 |
98.2 |
85.1 |
97.4 |
83.5 |
95.9 |
76.4 |
95.3 |
86.7 |
98.0 |
|
| 35-44 |
82.5 |
96.0 |
72.4 |
96.7 |
85.0 |
96.9 |
83.4 |
95.8 |
84.5 |
97.1 |
69.0 |
98.7 |
85.3 |
99.2 |
86.7 |
96.6 |
83.4 |
96.7 |
72.4 |
98.1 |
72.5 |
94.0 |
86.4 |
96.8 |
87.1 |
97.7 |
71.6 |
97.3 |
80.9 |
98.3 |
90.0 |
97.7 |
91.2 |
98.2 |
72.8 |
98.5 |
87.3 |
99.0 |
94.0 |
98.0 |
91.4 |
98.3 |
72.7 |
97.5 |
89.3 |
97.9 |
94.4 |
98.5 |
89.8 |
98.6 |
82.3 |
98.9 |
81.9 |
99.6 |
92.5 |
98.4 |
87.7 |
99.0 |
78.6 |
98.4 |
83.5 |
99.1 |
89.7 |
99.1 |
|
| 45-54 |
79.5 |
93.5 |
65.9 |
95.1 |
77.0 |
94.9 |
82.1 |
93.0 |
80.9 |
96.3 |
68.1 |
95.8 |
77.8 |
99.5 |
83.3 |
95.8 |
79.2 |
97.1 |
63.6 |
94.3 |
80.8 |
97.4 |
81.3 |
97.5 |
85.1 |
95.9 |
63.0 |
96.0 |
80.6 |
96.6 |
88.8 |
95.8 |
88.7 |
96.7 |
63.8 |
97.2 |
89.5 |
96.5 |
91.3 |
96.7 |
86.7 |
95.2 |
53.1 |
95.4 |
88.2 |
96.7 |
91.6 |
94.9 |
82.3 |
95.9 |
62.5 |
95.8 |
81.2 |
95.4 |
85.7 |
96.0 |
80.8 |
95.3 |
64.2 |
95.5 |
78.2 |
95.4 |
84.1 |
95.2 |
|
| 55-64 |
63.4 |
83.2 |
35.2 |
67.1 |
63.3 |
86.0 |
67.7 |
85.3 |
68.1 |
88.1 |
52.6 |
78.4 |
62.9 |
76.9 |
71.2 |
91.3 |
65.3 |
85.4 |
39.8 |
69.0 |
52.3 |
79.0 |
70.0 |
88.6 |
71.3 |
86.1 |
44.7 |
75.4 |
61.6 |
82.1 |
76.8 |
88.5 |
77.2 |
87.4 |
47.5 |
77.3 |
75.0 |
81.7 |
81.8 |
89.5 |
78.0 |
89.9 |
32.6 |
72.7 |
71.5 |
90.7 |
84.9 |
92.5 |
65.3 |
89.1 |
51.7 |
74.4 |
60.0 |
86.6 |
68.0 |
91.8 |
67.7 |
87.0 |
46.1 |
87.3 |
66.2 |
82.6 |
71.6 |
87.6 |
|
| Of which 15-24 |
75.5 |
78.4 |
58.2 |
51.4 |
71.4 |
65.3 |
79.0 |
84.2 |
74.8 |
79.3 |
53.6 |
47.2 |
60.1 |
65.8 |
79.7 |
85.6 |
70.6 |
77.2 |
52.6 |
46.5 |
56.0 |
65.1 |
75.7 |
82.6 |
74.4 |
77.7 |
53.5 |
45.8 |
63.6 |
61.6 |
79.1 |
83.5 |
77.8 |
79.5 |
57.1 |
44.0 |
68.6 |
64.8 |
82.0 |
85.7 |
78.4 |
78.8 |
53.7 |
45.2 |
66.3 |
67.8 |
83.7 |
85.3 |
72.6 |
74.0 |
61.6 |
52.3 |
66.1 |
62.6 |
75.2 |
79.0 |
68.6 |
75.0 |
53.6 |
49.5 |
64.1 |
55.0 |
71.6 |
81.5 |
|
|
| 5.
Labour force participation rate(15-64 years) by age group and level of
education |
|
| Percent. |
|
| Age group |
2004 |
2007 |
2008 |
2009 |
2010 |
2011 |
2012 |
2013 |
|
| None or only some education |
Primary school not completed |
Primary school completed |
Lower secondary completed |
Upper secondary completed |
Post secondary education |
Don’t know |
Total |
None or only some education |
Primary school not completed |
Primary school completed |
Lower secondary completed |
Upper secondary completed |
Post secondary education |
Don’t know |
Total |
None or only some education |
Primary school not completed |
Primary school completed |
Lower secondary completed |
Upper secondary completed |
Post secondary education |
Don’t know |
Total |
None or only some education |
Primary school not completed |
Primary school completed |
Lower secondary completed |
Upper secondary completed |
Post secondary education |
Don’t know |
Total |
None or only some education |
Primary school not completed |
Primary school completed |
Lower secondary completed |
Upper secondary completed |
Post secondary education |
Don’t know |
Total |
None or only some education |
Primary school not completed |
Primary school completed |
Lower secondary completed |
Upper secondary completed |
Post secondary education |
Don’t know |
Total |
None or only some education |
Primary school not completed |
Primary school completed |
Lower secondary completed |
Upper secondary completed |
Post secondary education |
Don’t know |
Total |
None or only some education |
Primary school not completed |
Primary school completed |
Lower secondary completed |
Upper secondary completed |
Post secondary education |
Don’t know |
Total |
|
|
|
| Labour
force (thousand) |
1,478 |
2,330 |
1,447 |
579 |
271 |
91 |
40 |
6,235 |
1,266 |
2,644 |
1,722 |
771 |
319 |
143 |
24 |
6,888 |
1,196 |
2,569 |
1,846 |
760 |
307 |
166 |
9 |
6,854 |
1,513 |
2,622 |
1,951 |
890 |
343 |
154 |
8 |
7,480 |
1,363 |
2,712 |
2,040 |
1,022 |
402 |
161 |
2 |
7,702 |
1,183 |
2,721 |
2,162 |
1,194 |
448 |
196 |
3 |
7,907 |
1,080 |
2,674 |
2,160 |
1,107 |
478 |
217 |
0 |
7,718 |
1,048 |
2,821 |
2,169 |
1,102 |
543 |
291 |
1 |
7,974 |
|
| Total 15
-64 |
23.7 |
37.4 |
23.2 |
9.3 |
4.4 |
1.5 |
0.6 |
100 |
18.4 |
38.4 |
25.0 |
11.2 |
4.6 |
2.1 |
0.3 |
100 |
17.4 |
37.5 |
26.9 |
11.1 |
4.5 |
2.4 |
0.1 |
100 |
20.2 |
35.1 |
26.1 |
11.9 |
4.6 |
2.1 |
0.1 |
100 |
17.7 |
35.2 |
26.5 |
13.3 |
5.2 |
2.1 |
0.0 |
100 |
15.0 |
34.4 |
27.3 |
15.1 |
5.7 |
2.5 |
0.0 |
100 |
14.0 |
34.6 |
28.0 |
14.3 |
6.2 |
2.8 |
- |
100 |
13.1 |
35.4 |
27.2 |
13.8 |
6.8 |
3.6 |
0.0 |
100 |
|
| 15-19 |
14.0 |
41.6 |
33.6 |
9.4 |
1.3 |
0.1 |
0.1 |
100 |
5.4 |
37.7 |
41.9 |
13.7 |
1.1 |
0.1 |
0.2 |
100 |
6.3 |
30.9 |
45.5 |
15.7 |
1.1 |
0.5 |
- |
100 |
9.4 |
31.2 |
40.9 |
17.0 |
1.2 |
0.3 |
- |
100 |
8.0 |
27.9 |
41.1 |
21.1 |
1.9 |
0.0 |
- |
100 |
4.9 |
27.1 |
41.6 |
24.8 |
1.6 |
- |
0.1 |
100 |
5.2 |
25.1 |
42.9 |
23.1 |
3.7 |
0.1 |
- |
100 |
5.4 |
30.6 |
42.7 |
18.4 |
2.8 |
0.2 |
- |
100 |
|
| 20-24 |
18.4 |
35.1 |
24.6 |
12.0 |
7.1 |
2.5 |
0.3 |
100 |
12.9 |
32.4 |
29.3 |
15.0 |
6.3 |
3.9 |
0.2 |
100 |
10.9 |
31.5 |
31.3 |
15.7 |
6.6 |
4.0 |
0.0 |
100 |
12.7 |
29.6 |
31.0 |
16.4 |
7.3 |
2.9 |
0.1 |
100 |
10.7 |
25.9 |
33.0 |
18.4 |
9.6 |
2.4 |
- |
100 |
7.9 |
22.9 |
33.8 |
21.6 |
11.0 |
2.9 |
- |
100 |
7.4 |
25.6 |
35.0 |
18.6 |
11.5 |
1.8 |
- |
100 |
5.9 |
25.2 |
32.6 |
19.6 |
12.5 |
4.1 |
0.0 |
100 |
|
| 25-34 |
22.3 |
34.9 |
24.5 |
9.1 |
6.7 |
2.2 |
0.4 |
100 |
19.2 |
36.9 |
22.8 |
10.9 |
6.5 |
3.0 |
0.5 |
100 |
15.1 |
37.6 |
25.6 |
10.7 |
6.9 |
4.0 |
0.1 |
100 |
19.1 |
34.0 |
25.3 |
11.5 |
6.5 |
3.5 |
0.0 |
100 |
15.6 |
33.9 |
26.2 |
13.2 |
7.0 |
4.2 |
0.0 |
100 |
11.8 |
35.1 |
26.8 |
14.4 |
7.0 |
4.9 |
- |
100 |
12.5 |
31.9 |
27.9 |
14.5 |
7.4 |
5.8 |
- |
100 |
11.4 |
32.2 |
25.9 |
15.4 |
8.4 |
6.7 |
- |
100 |
|
| 35-44 |
28.7 |
39.6 |
18.9 |
7.3 |
3.4 |
1.4 |
0.7 |
100 |
21.7 |
39.8 |
20.2 |
10.0 |
6.0 |
1.9 |
0.4 |
100 |
20.7 |
39.0 |
23.4 |
10.1 |
4.4 |
2.3 |
0.1 |
100 |
23.1 |
36.2 |
23.0 |
10.1 |
5.2 |
2.2 |
0.1 |
100 |
21.1 |
35.9 |
22.0 |
11.8 |
6.6 |
2.5 |
0.1 |
100 |
20.1 |
34.4 |
25.3 |
11.1 |
6.8 |
2.5 |
- |
100 |
16.1 |
37.2 |
25.5 |
11.8 |
6.9 |
2.5 |
- |
100 |
15.0 |
37.4 |
25.7 |
12.4 |
6.4 |
3.2 |
0.0 |
100 |
|
| 45-54 |
30.1 |
38.9 |
15.8 |
9.5 |
3.2 |
1.2 |
1.4 |
100 |
26.9 |
44.0 |
16.6 |
8.1 |
2.4 |
1.5 |
0.5 |
100 |
26.3 |
45.4 |
16.1 |
7.2 |
3.4 |
1.4 |
0.2 |
100 |
31.1 |
43.7 |
14.9 |
7.0 |
2.1 |
1.0 |
0.2 |
100 |
27.7 |
47.2 |
17.0 |
5.4 |
1.8 |
0.9 |
- |
100 |
23.3 |
46.6 |
16.3 |
9.6 |
2.7 |
1.3 |
0.1 |
100 |
22.7 |
47.2 |
16.8 |
9.3 |
2.2 |
1.7 |
- |
100 |
22.1 |
44.9 |
20.4 |
7.1 |
3.9 |
1.7 |
- |
100 |
|
| 55-64 |
38.6 |
30.7 |
16.9 |
8.3 |
3.0 |
0.4 |
2.1 |
100 |
30.2 |
42.9 |
15.2 |
7.3 |
3.2 |
1.0 |
0.2 |
100 |
32.1 |
41.6 |
17.5 |
5.3 |
2.2 |
0.9 |
0.4 |
100 |
31.9 |
37.5 |
18.7 |
8.0 |
2.8 |
1.0 |
0.2 |
100 |
29.5 |
46.6 |
14.9 |
6.8 |
1.7 |
0.4 |
0.1 |
100 |
30.0 |
44.1 |
15.8 |
7.0 |
2.2 |
0.7 |
0.2 |
100 |
25.3 |
48.3 |
16.9 |
6.6 |
1.7 |
1.1 |
0.2 |
100 |
24.3 |
52.0 |
14.6 |
5.8 |
1.7 |
1.6 |
- |
100 |
|
| of
which 15-24 |
16.2 |
38.3 |
29.1 |
10.7 |
4.2 |
1.3 |
0.2 |
100 |
9.2 |
35.0 |
35.6 |
14.4 |
3.7 |
2.0 |
0.2 |
100 |
8.6 |
31.2 |
38.5 |
15.7 |
3.8 |
2.2 |
0.0 |
100 |
11.1 |
30.4 |
35.9 |
16.7 |
4.3 |
1.6 |
0.0 |
100 |
9.3 |
27.0 |
37.2 |
19.8 |
5.5 |
1.2 |
- |
100 |
6.3 |
25.0 |
37.8 |
23.2 |
6.2 |
1.4 |
0.0 |
100 |
6.4 |
25.3 |
38.7 |
20.7 |
7.8 |
1.0 |
- |
100 |
5.7 |
27.4 |
36.7 |
19.1 |
8.6 |
2.5 |
- |
100 |
|
|
| 6.
Labour force participation rate(15-64 years) by age group, level of education
and sex |
|
| Percent. |
|
| Age
group |
2004 |
2007 |
2008 |
2009 |
2010 |
2011 |
2012 |
2013 |
| None or only some education |
Primary school not
completed |
Primary school completed |
Lower secondary
completed |
Upper secondary
completed |
Post secondary education |
Other / Don’t know |
None or only some
education |
Primary school not
completed |
Primary school completed |
Lower secondary
completed |
Upper secondary
completed |
Post secondary education |
Other / Don’t know |
None or only some
education |
Primary school not
completed |
Primary school completed |
Lower secondary
completed |
Upper secondary
completed |
Post secondary education |
Other / Don’t know |
None or only some
education |
Primary school not
completed |
Primary school completed |
Lower secondary
completed |
Upper secondary
completed |
Post secondary education |
Other / Don’t know |
None or only some
education |
Primary school not
completed |
Primary school completed |
Lower secondary
completed |
Upper secondary
completed |
Post secondary education |
Other / Don’t know |
None or only some
education |
Primary school not
completed |
Primary school completed |
Lower secondary
completed |
Upper secondary
completed |
Post secondary education |
Other / Don’t know |
None or only some
education |
Primary school not
completed |
Primary school completed |
Lower secondary
completed |
Upper secondary
completed |
Post secondary education |
Other / Don’t know |
None or only some
education |
Primary school not
completed |
Primary school completed |
Lower secondary
completed |
Upper secondary
completed |
Post secondary education |
Other / Don’t know |
| Women |
Men |
Women |
Men |
Women |
Men |
Women |
Men |
Women |
Men |
Women |
Men |
Women |
Men |
Women |
Men |
Women |
Men |
Women |
Men |
Women |
Men |
Women |
Men |
Women |
Men |
Women |
Men |
Women |
Men |
Women |
Men |
Women |
Men |
Women |
Men |
Women |
Men |
Women |
Men |
Women |
Men |
Women |
Men |
Women |
Men |
Women |
Men |
Women |
Men |
Women |
Men |
Women |
Men |
Women |
Men |
Women |
Men |
Women |
Men |
Women |
Men |
Women |
Men |
Women |
Men |
Women |
Men |
Women |
Men |
Women |
Men |
Women |
Men |
Women |
Men |
Women |
Men |
Women |
Men |
Women |
Men |
Women |
Men |
Women |
Men |
Women |
Men |
Women |
Men |
Women |
Men |
Women |
Men |
Women |
Men |
Women |
Men |
Women |
Men |
Women |
Men |
Women |
Men |
Women |
Men |
Women |
Men |
Women |
Men |
Women |
Men |
| Total (15-64) |
30.9 |
16.5 |
39.5 |
35.2 |
18.6 |
27.8 |
6.9 |
11.7 |
2.7 |
6.0 |
0.8 |
2.1 |
0.6 |
0.7 |
25.2 |
11.8 |
40.7 |
36.1 |
21.4 |
28.5 |
8.4 |
13.9 |
2.7 |
6.5 |
1.3 |
2.8 |
0.2 |
0.5 |
23.1 |
12.0 |
40.1 |
35.0 |
24.0 |
29.7 |
8.6 |
13.5 |
2.5 |
6.4 |
1.6 |
3.2 |
0.1 |
0.2 |
26.1 |
14.4 |
37.6 |
32.5 |
22.9 |
29.2 |
9.1 |
14.7 |
2.9 |
6.2 |
1.3 |
2.9 |
0.1 |
0.1 |
23.3 |
12.0 |
38.0 |
32.4 |
24.1 |
28.9 |
10.1 |
16.5 |
3.4 |
7.1 |
1.2 |
3.0 |
0.0 |
0.0 |
20.4 |
9.5 |
36.9 |
31.9 |
25.2 |
29.5 |
12.1 |
18.1 |
3.9 |
7.5 |
1.5 |
3.4 |
0.0 |
0.1 |
17.8 |
10.3 |
38.4 |
31.1 |
26.0 |
29.9 |
11.5 |
17.1 |
4.6 |
7.7 |
1.8 |
3.8 |
0.0 |
- |
17.4 |
9.1 |
38.5 |
32.4 |
25.9 |
28.4 |
10.7 |
16.8 |
4.9 |
8.6 |
2.5 |
4.8 |
- |
- |
| 15-19 |
16.0 |
12.0 |
42.3 |
40.8 |
31.5 |
35.6 |
8.8 |
9.9 |
1.2 |
1.3 |
0.1 |
0.2 |
0.1 |
0.1 |
6.1 |
4.6 |
39.8 |
35.4 |
40.7 |
43.1 |
12.0 |
15.5 |
1.0 |
1.2 |
0.2 |
- |
0.1 |
0.2 |
5.2 |
7.4 |
33.6 |
28.2 |
45.1 |
46.0 |
14.1 |
17.3 |
1.5 |
0.6 |
0.4 |
0.5 |
- |
- |
9.7 |
9.1 |
30.2 |
32.2 |
41.7 |
40.2 |
16.7 |
17.3 |
1.3 |
1.1 |
0.4 |
0.2 |
- |
0.0 |
6.2 |
9.8 |
27.0 |
28.8 |
45.0 |
37.4 |
19.5 |
22.5 |
2.3 |
1.5 |
- |
0.1 |
- |
- |
4.3 |
5.5 |
24.4 |
29.7 |
42.9 |
40.3 |
25.5 |
24.1 |
2.8 |
0.4 |
- |
- |
0.2 |
- |
5.0 |
5.3 |
24.7 |
25.4 |
43.9 |
41.8 |
23.3 |
22.9 |
3.0 |
4.3 |
- |
0.2 |
- |
- |
7.0 |
3.9 |
27.1 |
33.7 |
46.4 |
39.3 |
16.9 |
19.7 |
2.4 |
3.2 |
0.2 |
0.2 |
- |
- |
| 20-24 |
21.8 |
15.1 |
37.7 |
32.6 |
23.3 |
25.8 |
9.2 |
14.7 |
5.8 |
8.4 |
2.0 |
3.0 |
0.2 |
0.4 |
17.9 |
8.3 |
34.5 |
30.5 |
26.2 |
32.1 |
12.8 |
17.0 |
5.0 |
7.4 |
3.4 |
4.3 |
- |
0.3 |
12.6 |
9.4 |
33.5 |
29.6 |
31.9 |
30.8 |
13.2 |
17.9 |
4.7 |
8.2 |
4.0 |
4.0 |
- |
0.1 |
13.7 |
11.8 |
32.8 |
26.7 |
32.0 |
30.2 |
12.5 |
20.0 |
5.9 |
8.7 |
3.1 |
2.7 |
0.1 |
0.0 |
13.8 |
7.9 |
28.0 |
23.8 |
31.5 |
34.5 |
16.4 |
20.3 |
8.0 |
11.0 |
2.4 |
2.5 |
- |
- |
9.5 |
6.3 |
24.7 |
21.0 |
34.3 |
33.4 |
18.7 |
24.5 |
9.5 |
12.5 |
3.4 |
2.3 |
- |
- |
7.6 |
7.3 |
27.1 |
24.1 |
36.5 |
33.6 |
14.5 |
22.6 |
12.3 |
10.7 |
2.0 |
1.7 |
- |
- |
6.3 |
5.7 |
25.6 |
24.8 |
33.7 |
31.6 |
18.5 |
20.6 |
11.9 |
12.9 |
3.8 |
4.4 |
- |
- |
| 25-34 |
27.7 |
17.4 |
40.4 |
29.9 |
20.0 |
28.5 |
6.5 |
11.4 |
3.9 |
9.1 |
1.0 |
3.3 |
0.4 |
0.4 |
24.7 |
14.6 |
40.7 |
33.7 |
20.7 |
24.6 |
7.7 |
13.7 |
4.1 |
8.7 |
1.9 |
4.0 |
0.2 |
0.7 |
20.6 |
10.5 |
41.3 |
34.5 |
23.1 |
27.7 |
8.2 |
12.7 |
3.8 |
9.4 |
2.8 |
5.0 |
0.1 |
0.1 |
24.0 |
14.4 |
38.2 |
30.0 |
23.0 |
27.6 |
8.6 |
14.3 |
4.1 |
8.7 |
2.1 |
4.9 |
- |
0.0 |
19.3 |
12.1 |
38.2 |
29.8 |
26.2 |
26.1 |
9.4 |
16.8 |
4.0 |
9.8 |
2.8 |
5.4 |
0.0 |
- |
16.4 |
7.6 |
39.4 |
31.0 |
25.1 |
28.4 |
11.0 |
17.5 |
5.0 |
8.9 |
3.1 |
6.5 |
- |
- |
15.4 |
9.9 |
36.9 |
27.5 |
26.8 |
28.9 |
11.5 |
17.1 |
5.2 |
9.3 |
4.2 |
7.2 |
- |
- |
13.2 |
9.7 |
38.1 |
26.7 |
25.9 |
26.0 |
11.6 |
18.9 |
6.1 |
10.6 |
5.2 |
8.1 |
- |
- |
| 35-44 |
37.5 |
19.9 |
43.4 |
35.7 |
12.0 |
25.9 |
4.6 |
9.9 |
1.1 |
5.7 |
0.8 |
2.0 |
0.6 |
0.8 |
30.1 |
13.4 |
44.5 |
35.2 |
15.6 |
24.7 |
6.2 |
13.8 |
2.6 |
9.3 |
0.7 |
3.1 |
0.3 |
0.5 |
27.2 |
14.0 |
43.7 |
34.2 |
18.7 |
28.2 |
8.2 |
12.1 |
1.3 |
7.6 |
0.9 |
3.7 |
- |
0.2 |
30.2 |
16.1 |
41.3 |
31.2 |
18.0 |
27.9 |
7.0 |
13.2 |
2.7 |
7.7 |
0.7 |
3.7 |
0.2 |
0.1 |
27.6 |
14.1 |
42.6 |
28.9 |
17.6 |
26.6 |
8.0 |
16.0 |
3.6 |
9.8 |
0.6 |
4.5 |
- |
0.1 |
27.2 |
12.7 |
37.3 |
31.4 |
23.4 |
27.2 |
8.6 |
13.6 |
2.6 |
11.1 |
0.8 |
4.1 |
- |
- |
19.8 |
12.5 |
43.7 |
30.9 |
23.0 |
27.9 |
8.5 |
15.0 |
3.8 |
9.9 |
1.1 |
3.8 |
- |
- |
20.9 |
9.2 |
41.1 |
33.8 |
25.0 |
26.4 |
8.6 |
16.0 |
3.3 |
9.4 |
1.0 |
5.3 |
- |
- |
| 45-54 |
40.8 |
17.4 |
38.5 |
39.4 |
10.4 |
22.2 |
6.6 |
12.9 |
2.1 |
4.4 |
0.5 |
2.0 |
1.1 |
1.7 |
36.4 |
16.3 |
43.0 |
45.2 |
12.6 |
21.1 |
6.0 |
10.4 |
0.7 |
4.4 |
0.9 |
2.1 |
0.5 |
0.5 |
36.0 |
16.3 |
45.2 |
45.6 |
12.4 |
19.9 |
3.7 |
10.8 |
1.9 |
4.9 |
0.5 |
2.3 |
0.2 |
0.2 |
40.7 |
20.2 |
44.0 |
43.2 |
9.3 |
21.2 |
4.4 |
10.1 |
1.1 |
3.2 |
0.3 |
1.8 |
0.2 |
0.3 |
37.0 |
16.9 |
48.3 |
45.8 |
10.8 |
24.2 |
3.1 |
8.0 |
0.5 |
3.4 |
0.2 |
1.6 |
- |
- |
31.8 |
14.1 |
50.9 |
42.0 |
11.1 |
21.9 |
4.7 |
15.0 |
1.3 |
4.3 |
0.2 |
2.5 |
- |
0.2 |
31.0 |
14.1 |
51.7 |
42.6 |
11.1 |
22.8 |
5.2 |
13.6 |
0.4 |
4.1 |
0.6 |
2.9 |
- |
- |
30.9 |
13.5 |
49.6 |
40.3 |
14.1 |
26.5 |
3.2 |
10.9 |
1.7 |
6.1 |
0.6 |
2.8 |
- |
- |
| 55-64 |
59.1 |
17.2 |
25.8 |
35.7 |
7.6 |
26.7 |
4.6 |
12.3 |
1.2 |
4.8 |
- |
0.9 |
1.7 |
2.5 |
47.1 |
12.5 |
41.1 |
44.7 |
4.9 |
26.0 |
4.3 |
10.5 |
1.7 |
4.7 |
0.5 |
1.6 |
0.4 |
- |
45.7 |
18.0 |
41.7 |
41.5 |
9.2 |
26.0 |
2.1 |
8.6 |
0.6 |
3.9 |
0.3 |
1.6 |
0.3 |
0.4 |
46.5 |
15.7 |
36.9 |
38.1 |
10.6 |
27.7 |
4.7 |
11.6 |
1.0 |
4.8 |
0.2 |
1.8 |
0.1 |
0.3 |
44.6 |
10.7 |
43.1 |
51.1 |
8.4 |
22.9 |
2.6 |
12.0 |
1.0 |
2.5 |
0.4 |
0.5 |
- |
0.3 |
42.5 |
14.7 |
44.6 |
43.6 |
9.3 |
23.9 |
3.0 |
12.0 |
0.6 |
4.2 |
0.1 |
1.4 |
- |
0.4 |
35.8 |
14.0 |
49.0 |
47.6 |
9.4 |
25.0 |
4.8 |
8.5 |
0.6 |
2.8 |
0.1 |
2.1 |
0.3 |
- |
32.9 |
14.0 |
53.1 |
50.8 |
8.8 |
21.4 |
3.5 |
8.6 |
0.8 |
2.7 |
0.9 |
2.5 |
- |
- |
| Of which 15-24 |
18.9 |
13.5 |
40.0 |
36.7 |
27.4 |
30.7 |
9.0 |
12.3 |
3.5 |
4.8 |
1.0 |
1.6 |
0.1 |
0.2 |
11.9 |
6.5 |
37.3 |
32.9 |
33.7 |
37.4 |
12.4 |
16.3 |
2.9 |
4.4 |
1.8 |
2.2 |
0.1 |
0.3 |
8.8 |
8.4 |
33.5 |
28.9 |
38.8 |
38.2 |
13.7 |
17.6 |
3.1 |
4.5 |
2.2 |
2.3 |
- |
0.0 |
11.7 |
10.4 |
31.5 |
29.4 |
36.8 |
35.2 |
14.5 |
18.7 |
3.6 |
4.9 |
1.8 |
1.4 |
0.0 |
0.0 |
9.8 |
8.9 |
27.5 |
26.5 |
38.5 |
36.0 |
18.0 |
21.4 |
5.1 |
6.0 |
1.1 |
1.2 |
- |
- |
6.8 |
5.9 |
24.5 |
25.5 |
38.7 |
37.0 |
22.1 |
24.3 |
6.1 |
6.3 |
1.7 |
1.1 |
0.1 |
- |
6.4 |
6.4 |
26.0 |
24.7 |
40.0 |
37.4 |
18.7 |
22.7 |
7.9 |
7.8 |
1.1 |
1.0 |
- |
- |
6.5 |
5.0 |
26.3 |
28.4 |
38.9 |
34.7 |
17.9 |
20.3 |
8.0 |
9.0 |
2.3 |
2.7 |
- |
- |
|
| 7.
Employment status, main occupation (15-64 years), by sex |
|
| Percent. |
|
| Employment status |
2004 |
2007 |
2008 |
2009 |
2010 |
2011 |
2012 |
2013 |
|
| Women |
Men |
Both Sexes |
Women |
Men |
Both Sexes |
Women |
Men |
Both Sexes |
Women |
Men |
Both Sexes |
Women |
Men |
Both Sexes |
Women |
Men |
Both Sexes |
Women |
Men |
Both Sexes |
Women |
Men |
Both Sexes |
|
| Employed population, number
(thousand) |
3,246 |
3,331 |
6,577 |
3,596 |
3,718 |
7,313 |
3,534 |
3,775 |
7,309 |
3,715 |
3,754 |
7,469 |
3,869 |
3,806 |
7,675 |
3,959 |
3,932 |
7,891 |
3,782 |
3,924 |
7,706 |
3,882 |
4,068 |
7,951 |
|
| Paid employee |
18.6 |
27.1 |
22.9 |
21.8 |
29.6 |
25.8 |
24.0 |
32.6 |
28.4 |
22.8 |
30.9 |
26.9 |
24.3 |
35.4 |
29.8 |
27.1 |
35.8 |
31.4 |
30.3 |
41.2 |
35.8 |
34.9 |
46.1 |
40.6 |
|
| Employer |
0.1 |
0.1 |
0.1 |
0.0 |
0.1 |
0.1 |
0.0 |
0.1 |
0.1 |
0.3 |
0.3 |
0.3 |
0.2 |
0.2 |
0.2 |
0.0 |
0.0 |
0.0 |
0.0 |
0.0 |
0.0 |
- |
0.0 |
0.0 |
|
| Own account
worker/self-employed |
32.6 |
44.1 |
38.5 |
30.5 |
45.6 |
38.2 |
30.8 |
43.0 |
37.1 |
52.4 |
46.0 |
49.2 |
56.0 |
44.7 |
50.4 |
58.8 |
47.9 |
53.4 |
60.4 |
50.0 |
55.1 |
60.1 |
49.6 |
54.7 |
|
| Unpaid family worker |
46.5 |
27.0 |
36.6 |
47.6 |
24.7 |
35.9 |
45.2 |
24.1 |
34.3 |
24.4 |
22.6 |
23.5 |
19.3 |
19.5 |
19.4 |
13.9 |
16.2 |
15.1 |
9.3 |
8.8 |
9.0 |
5.0 |
4.3 |
4.7 |
|
| Other/Don’t know |
2.2 |
1.6 |
1.9 |
0.1 |
0.1 |
0.1 |
0.1 |
0.1 |
0.1 |
0.1 |
0.1 |
0.1 |
0.3 |
0.2 |
0.2 |
0.1 |
0.1 |
0.1 |
- |
0.0 |
0.0 |
- |
- |
- |
|
| Total |
100 |
100 |
100 |
100 |
100 |
100 |
100 |
100 |
100 |
100 |
100 |
100 |
100 |
100 |
100 |
100 |
100 |
100 |
100 |
100 |
100 |
100 |
100 |
100 |
|
|
| 8.
Employment status, main occupation (15-64 years), by geographical domain |
|
| Percent. |
|
| Employment status |
2004 |
2007 |
2008 |
2009 |
2010 |
2011 |
2012 |
2013 |
|
| Cambodia |
Phnom Penh |
Other urban |
Other rural |
Cambodia |
Phnom Penh |
Other urban |
Other rural |
Cambodia |
Phnom Penh |
Other urban |
Other rural |
Cambodia |
Phnom Penh |
Other urban |
Other rural |
Cambodia |
Phnom Penh |
Other urban |
Other rural |
Cambodia |
Phnom Penh |
Other urban |
Other rural |
Cambodia |
Phnom Penh |
Other urban |
Other rural |
Cambodia |
Phnom Penh |
Other urban |
Other rural |
|
| Employed population, number
(thousand) |
6,577 |
591 |
713 |
5,273 |
7,313 |
670 |
685 |
5,959 |
7,309 |
680 |
698 |
5,932 |
7,469 |
686 |
735 |
6,048 |
7,675 |
688 |
772 |
6,215 |
7,891 |
770 |
793 |
6,328 |
7,706 |
848 |
950 |
5,908 |
7,951 |
942 |
810 |
6,199 |
|
| Paid employee |
22.9 |
50.9 |
29.7 |
18.9 |
25.8 |
50.1 |
40.3 |
21.4 |
28.4 |
53.5 |
42.1 |
23.9 |
26.9 |
53.2 |
36.1 |
22.7 |
29.8 |
58.9 |
40.1 |
25.3 |
31.4 |
64.0 |
39.9 |
26.4 |
35.8 |
55.5 |
42.9 |
31.8 |
40.6 |
63.6 |
45.0 |
36.6 |
|
| Employer |
0.1 |
0.0 |
0.1 |
0.1 |
0.1 |
0.2 |
0.4 |
- |
0.1 |
0.3 |
0.2 |
0.0 |
0.3 |
0.2 |
0.5 |
0.3 |
0.2 |
0.1 |
- |
0.2 |
0.0 |
0.1 |
- |
- |
0.0 |
0.0 |
0.2 |
0.0 |
0.0 |
0.0 |
- |
0.0 |
|
| Own account
worker/self-employed |
38.5 |
27.7 |
36.8 |
39.9 |
38.2 |
27.2 |
37.1 |
39.5 |
37.1 |
24.8 |
34.0 |
38.9 |
49.2 |
32.5 |
43.9 |
51.7 |
50.4 |
28.7 |
44.2 |
53.6 |
53.4 |
26.9 |
48.7 |
57.2 |
55.1 |
33.9 |
50.3 |
59.0 |
54.7 |
30.6 |
52.8 |
58.6 |
|
| Unpaid family worker |
36.6 |
19.6 |
31.7 |
39.2 |
35.9 |
22.5 |
21.9 |
39.1 |
34.3 |
21.1 |
23.7 |
37.0 |
23.5 |
14.0 |
19.4 |
25.1 |
19.4 |
12.3 |
15.8 |
20.6 |
15.1 |
9.0 |
11.3 |
16.3 |
9.0 |
10.5 |
6.6 |
9.2 |
4.7 |
5.8 |
2.2 |
4.8 |
|
| Other/Don’t know |
1.9 |
1.8 |
1.6 |
1.9 |
0.1 |
0.0 |
0.3 |
0.0 |
0.1 |
0.3 |
- |
0.1 |
0.1 |
0.2 |
0.2 |
0.1 |
0.2 |
- |
- |
0.3 |
0.1 |
0.1 |
0.1 |
0.1 |
0.0 |
0.1 |
0.0 |
- |
- |
- |
- |
- |
|
| Total |
100 |
100 |
100 |
100 |
100 |
100 |
100 |
100 |
100 |
100 |
100 |
100 |
100 |
100 |
100 |
100 |
100 |
100 |
100 |
100 |
100 |
100 |
100 |
100 |
100 |
100 |
100 |
100 |
100 |
100 |
100 |
100 |
|
|
| 9.
Employment status, main occupation (15-64 years), by geographical domain and
sex |
|
| Percent. |
|
| Employment status |
2004 |
2007 |
2008 |
2009 |
2010 |
2011 |
2012 |
2013 |
|
| Cambodia |
Phnom Penh |
Other urban |
Other rural |
Cambodia |
Phnom Penh |
Other urban |
Other rural |
Cambodia |
Phnom Penh |
Other urban |
Other rural |
Cambodia |
Phnom Penh |
Other urban |
Other rural |
Cambodia |
Phnom Penh |
Other urban |
Other rural |
Cambodia |
Phnom Penh |
Other urban |
Other rural |
Cambodia |
Phnom Penh |
Other urban |
Other rural |
Cambodia |
Phnom Penh |
Other urban |
Other rural |
|
| Women |
Men |
Women |
Men |
Women |
Men |
Women |
Men |
Women |
Men |
Women |
Men |
Women |
Men |
Women |
Men |
Women |
Men |
Women |
Men |
Women |
Men |
Women |
Men |
Women |
Men |
Women |
Men |
Women |
Men |
Women |
Men |
Women |
Men |
Women |
Men |
Women |
Men |
Women |
Men |
Women |
Men |
Women |
Men |
Women |
Men |
Women |
Men |
Women |
Men |
Women |
Men |
Women |
Men |
Women |
Men |
Women |
Men |
Women |
Men |
Women |
Men |
Women |
Men |
|
| Employed population, number
(thousand) |
3,079 |
3,092 |
280 |
294 |
339 |
331 |
2,461 |
2,467 |
3,596 |
3,718 |
319 |
350 |
305 |
380 |
2,971 |
2,987 |
3,534 |
3,775 |
320 |
360 |
321 |
376 |
2,893 |
3,039 |
3,715 |
3,754 |
335 |
351 |
362 |
373 |
3,018 |
3,030 |
3,869 |
3,806 |
326 |
362 |
401 |
371 |
3,142 |
3,073 |
3,959 |
3,932 |
354 |
416 |
403 |
389 |
3,202 |
3,127 |
3,782 |
3,924 |
421 |
428 |
454 |
495 |
2,907 |
3,001 |
3,882 |
4,068 |
445 |
497 |
393 |
417 |
3,045 |
3,155 |
|
| Paid employee |
19.6 |
29.2 |
43.1 |
61.3 |
23.8 |
39.7 |
16.4 |
24.0 |
21.8 |
29.6 |
44.3 |
55.4 |
30.3 |
48.2 |
18.5 |
24.2 |
24.0 |
32.6 |
43.6 |
62.3 |
33.9 |
49.1 |
20.7 |
27.0 |
22.8 |
30.9 |
44.1 |
61.8 |
30.9 |
41.2 |
19.4 |
26.0 |
24.3 |
35.4 |
52.2 |
65.0 |
35.4 |
45.2 |
19.9 |
30.7 |
27.1 |
35.8 |
59.2 |
68.1 |
32.6 |
47.6 |
22.9 |
30.1 |
30.3 |
41.1 |
50.7 |
60.3 |
34.5 |
50.7 |
26.6 |
36.9 |
34.9 |
46.1 |
56.3 |
70.1 |
34.9 |
54.5 |
31.8 |
41.2 |
|
| Employer |
0.1 |
0.1 |
0.0 |
0.0 |
- |
0.3 |
0.1 |
0.1 |
0.0 |
0.1 |
0.0 |
0.3 |
0.4 |
0.5 |
- |
- |
0.0 |
0.1 |
0.2 |
0.5 |
- |
0.4 |
- |
0.1 |
0.3 |
0.3 |
0.2 |
0.1 |
0.5 |
0.4 |
0.3 |
0.4 |
0.2 |
0.2 |
- |
0.1 |
- |
- |
0.2 |
0.2 |
0.0 |
0.0 |
0.1 |
0.1 |
- |
- |
- |
- |
0.0 |
0.0 |
0.1 |
- |
0.2 |
0.1 |
- |
0.0 |
- |
0.0 |
- |
- |
- |
- |
- |
0.0 |
|
| Own account
worker/self-employed |
34.4 |
47.6 |
32.1 |
25.2 |
37.6 |
40.9 |
34.2 |
51.1 |
30.5 |
45.6 |
27.8 |
26.6 |
36.1 |
37.9 |
30.2 |
48.8 |
30.8 |
43.0 |
28.8 |
21.2 |
34.1 |
34.0 |
30.7 |
46.8 |
52.4 |
46.0 |
38.1 |
27.2 |
47.2 |
40.7 |
54.6 |
48.9 |
56.0 |
44.7 |
32.8 |
25.0 |
47.7 |
40.3 |
59.5 |
47.6 |
58.8 |
47.9 |
31.1 |
23.2 |
54.9 |
42.3 |
62.4 |
51.9 |
60.4 |
50.0 |
37.6 |
30.2 |
58.0 |
43.1 |
64.1 |
54.0 |
60.1 |
49.6 |
34.9 |
26.7 |
62.3 |
43.8 |
63.5 |
54.0 |
|
| Unpaid family worker |
49.0 |
29.1 |
24.2 |
16.3 |
41.8 |
25.5 |
52.9 |
31.1 |
47.6 |
24.7 |
27.8 |
17.7 |
32.7 |
13.3 |
51.3 |
26.9 |
45.2 |
24.1 |
27.2 |
15.7 |
32.1 |
16.6 |
48.6 |
26.0 |
24.4 |
22.6 |
17.5 |
10.6 |
21.2 |
17.6 |
25.6 |
24.6 |
19.3 |
19.5 |
15.0 |
9.9 |
16.9 |
14.5 |
20.0 |
21.3 |
13.9 |
16.2 |
9.6 |
8.5 |
12.5 |
10.0 |
14.6 |
18.0 |
9.3 |
8.8 |
11.6 |
9.4 |
7.2 |
6.1 |
9.2 |
9.1 |
5.0 |
4.3 |
8.9 |
3.0 |
2.8 |
1.7 |
4.8 |
4.9 |
|
| Other/Don’t know |
2.3 |
1.7 |
2.3 |
1.4 |
2.4 |
1.2 |
2.3 |
1.8 |
0.1 |
0.1 |
0.1 |
- |
0.4 |
0.1 |
0.0 |
0.1 |
0.1 |
0.1 |
0.2 |
0.3 |
- |
- |
0.0 |
0.1 |
0.1 |
0.1 |
0.1 |
0.3 |
0.2 |
0.1 |
0.1 |
0.1 |
0.3 |
0.2 |
- |
- |
- |
- |
0.3 |
0.3 |
0.1 |
0.1 |
- |
0.1 |
- |
0.2 |
0.1 |
0.0 |
- |
0.0 |
- |
0.1 |
- |
0.1 |
- |
- |
- |
- |
- |
- |
- |
- |
- |
- |
|
| Total |
100 |
100 |
100 |
100 |
100 |
100 |
100 |
100 |
100 |
100 |
100 |
100 |
100 |
100 |
100 |
100 |
100 |
100 |
100 |
100 |
100 |
100 |
100 |
100 |
100 |
100 |
100 |
100 |
100 |
100 |
100 |
100 |
100 |
100 |
100 |
100 |
100 |
100 |
100 |
100 |
100 |
100 |
100 |
100 |
100 |
100 |
100 |
100 |
100 |
100 |
100 |
100 |
100 |
100 |
100 |
100 |
100 |
100 |
100 |
100 |
100 |
100 |
100 |
100 |
|
|
| 10.
Employment population (15-64 years) by main occupation and sex |
|
| Percent. |
|
| Main occupation |
2004 |
2007 |
2008 |
2009 |
2010 |
2011 |
2012 |
2013 |
|
| Women |
Men |
Both Sexes |
Women |
Men |
Both Sexes |
Women |
Men |
Both Sexes |
Women |
Men |
Both Sexes |
Women |
Men |
Both Sexes |
Women |
Men |
Both Sexes |
Women |
Men |
Both Sexes |
Women |
Men |
Both Sexes |
|
| Armed forces occupations |
0.1 |
1.6 |
0.9 |
0.0 |
0.9 |
0.5 |
0.1 |
0.9 |
0.5 |
0.1 |
1.2 |
0.7 |
0.1 |
1.5 |
0.8 |
0.1 |
1.5 |
0.8 |
0.1 |
1.6 |
0.9 |
0.0 |
1.4 |
0.7 |
|
| Manager |
0.5 |
2.1 |
1.3 |
0.5 |
1.2 |
0.9 |
0.3 |
1.3 |
0.8 |
0.2 |
0.8 |
0.5 |
0.2 |
0.9 |
0.5 |
0.2 |
0.9 |
0.6 |
0.4 |
1.0 |
0.7 |
0.6 |
1.2 |
0.9 |
|
| Professionals |
2.7 |
4.9 |
3.8 |
2.5 |
3.5 |
3.0 |
2.6 |
4.0 |
3.3 |
2.0 |
3.1 |
2.5 |
2.0 |
3.5 |
2.7 |
1.8 |
2.5 |
2.2 |
2.3 |
2.8 |
2.5 |
3.0 |
2.9 |
2.9 |
|
| Technicians and associate professionals |
0.5 |
0.8 |
0.6 |
1.1 |
2.9 |
2.0 |
1.0 |
3.4 |
2.2 |
0.5 |
1.2 |
0.9 |
0.5 |
1.2 |
0.9 |
0.5 |
1.0 |
0.8 |
0.5 |
1.4 |
1.0 |
0.7 |
1.1 |
0.9 |
|
| Clerical support workers |
0.2 |
0.2 |
0.2 |
1.5 |
2.3 |
1.9 |
1.8 |
3.1 |
2.5 |
1.5 |
2.4 |
1.9 |
1.6 |
3.2 |
2.4 |
1.7 |
2.9 |
2.3 |
2.1 |
3.0 |
2.6 |
2.2 |
3.7 |
3.0 |
|
| Service and sales workers |
18.5 |
8.7 |
13.6 |
17.0 |
7.3 |
12.0 |
14.5 |
4.9 |
9.6 |
19.6 |
9.8 |
14.7 |
22.4 |
10.9 |
16.7 |
19.9 |
11.4 |
15.6 |
21.6 |
11.1 |
16.2 |
22.8 |
11.2 |
16.8 |
|
| Skilled agricultural, forestry and fishery
workers |
58.1 |
59.4 |
58.7 |
52.7 |
50.1 |
51.3 |
47.9 |
48.0 |
47.9 |
47.8 |
48.1 |
48.0 |
44.7 |
43.5 |
44.1 |
44.7 |
45.3 |
45.0 |
42.4 |
41.0 |
41.7 |
41.4 |
38.2 |
39.8 |
|
| Craft and related worker |
6.6 |
5.5 |
6.1 |
6.8 |
11.8 |
9.4 |
7.0 |
11.5 |
9.3 |
13.8 |
10.0 |
11.9 |
13.7 |
11.8 |
12.8 |
15.2 |
11.1 |
13.1 |
15.4 |
13.9 |
14.6 |
16.5 |
16.6 |
16.5 |
|
| Plant and machine operators and assemblers |
5.8 |
6.5 |
6.1 |
7.5 |
9.4 |
8.4 |
8.8 |
9.3 |
9.0 |
0.5 |
5.4 |
3.0 |
0.5 |
6.2 |
3.3 |
0.3 |
5.1 |
2.7 |
0.3 |
6.2 |
3.3 |
0.6 |
6.5 |
3.6 |
|
| Elementary occupations |
6.7 |
10.0 |
8.4 |
10.3 |
10.7 |
10.5 |
16.0 |
13.6 |
14.8 |
13.9 |
17.8 |
15.9 |
14.4 |
17.3 |
15.9 |
15.6 |
18.3 |
17.0 |
14.9 |
18.0 |
16.5 |
12.2 |
17.2 |
14.8 |
|
| Other/Don’t know/Not stated |
0.3 |
0.3 |
0.3 |
0.0 |
0.0 |
0.0 |
0.1 |
0.1 |
0.1 |
- |
- |
- |
- |
- |
- |
- |
- |
- |
- |
- |
- |
- |
- |
- |
|
| Total |
100 |
100 |
100 |
100 |
100 |
100 |
100 |
100 |
100 |
100 |
100 |
100 |
100 |
100 |
100 |
100 |
100 |
100 |
100 |
100 |
100 |
100 |
100 |
100 |
|
|
| 11.
Employment population (15-64 years) by main occupation and geographical
domain |
|
| Percent. |
|
| Main occupation |
2004 |
2007 |
2008 |
2009 |
2010 |
2011 |
2012 |
2013 |
|
| Cambodia |
Phnom Penh |
Other urban |
Other rural |
Cambodia |
Phnom Penh |
Other urban |
Other rural |
Cambodia |
Phnom Penh |
Other urban |
Other rural |
Cambodia |
Phnom Penh |
Other urban |
Other rural |
Cambodia |
Phnom Penh |
Other urban |
Other rural |
Cambodia |
Phnom Penh |
Other urban |
Other rural |
Cambodia |
Phnom Penh |
Other urban |
Other rural |
Cambodia |
Phnom Penh |
Other urban |
Other rural |
|
| Armed forces occupations |
0.8 |
3.2 |
1.9 |
0.4 |
0.4 |
1.5 |
0.9 |
0.2 |
0.5 |
2.3 |
1.0 |
0.2 |
0.7 |
2.3 |
1.3 |
0.4 |
0.8 |
1.7 |
1.1 |
0.6 |
0.8 |
3.0 |
1.3 |
0.4 |
0.9 |
1.6 |
2.1 |
0.5 |
0.7 |
1.7 |
0.7 |
0.6 |
|
| Manager |
1.3 |
5.7 |
1.8 |
0.7 |
0.8 |
1.7 |
2.5 |
0.5 |
0.8 |
2.8 |
0.7 |
0.6 |
0.5 |
1.5 |
0.5 |
0.4 |
0.5 |
1.4 |
0.8 |
0.4 |
0.6 |
1.5 |
0.6 |
0.4 |
0.7 |
1.4 |
1.4 |
0.5 |
0.9 |
1.0 |
1.6 |
0.8 |
|
| Professionals |
3.7 |
15.4 |
7.0 |
1.9 |
2.9 |
13.5 |
5.0 |
1.4 |
3.1 |
14.1 |
6.6 |
1.5 |
2.5 |
7.2 |
5.9 |
1.6 |
2.7 |
7.4 |
5.1 |
1.9 |
2.2 |
7.9 |
5.7 |
1.0 |
2.5 |
5.9 |
5.0 |
1.6 |
2.9 |
8.5 |
6.0 |
1.7 |
|
| Technicians and associate professionals |
0.6 |
3.4 |
1.2 |
0.3 |
2.1 |
7.6 |
5.5 |
1.1 |
2.3 |
7.4 |
4.3 |
1.5 |
0.9 |
3.7 |
1.6 |
0.5 |
0.9 |
4.1 |
1.3 |
0.4 |
0.8 |
3.4 |
1.3 |
0.4 |
1.0 |
2.2 |
1.9 |
0.6 |
0.9 |
2.1 |
2.0 |
0.6 |
|
| Clerical support workers |
0.2 |
1.0 |
0.4 |
0.1 |
1.9 |
10.3 |
4.0 |
0.7 |
2.4 |
12.1 |
5.0 |
1.0 |
1.9 |
11.3 |
4.6 |
0.6 |
2.4 |
12.4 |
3.7 |
1.1 |
2.3 |
12.8 |
4.5 |
0.8 |
2.6 |
9.9 |
6.1 |
0.9 |
3.0 |
12.0 |
7.6 |
1.0 |
|
| Service and sales workers |
13.7 |
32.6 |
24.5 |
10.1 |
12.1 |
33.9 |
21.9 |
8.6 |
9.6 |
28.5 |
15.6 |
6.8 |
14.7 |
38.4 |
31.6 |
10.0 |
16.7 |
36.9 |
37.0 |
11.9 |
15.6 |
35.9 |
36.9 |
10.5 |
16.2 |
36.5 |
35.9 |
10.2 |
16.8 |
34.6 |
38.9 |
11.3 |
|
| Skilled agricultural, forestry and fishery
workers |
56.7 |
1.1 |
35.0 |
65.8 |
50.0 |
1.3 |
26.6 |
58.0 |
47.4 |
0.4 |
25.0 |
55.3 |
47.9 |
1.8 |
19.7 |
56.6 |
44.1 |
1.5 |
15.3 |
52.4 |
45.0 |
2.0 |
16.6 |
53.8 |
41.7 |
4.8 |
11.6 |
51.9 |
39.8 |
1.6 |
10.8 |
49.3 |
|
| Craft and related worker |
6.7 |
10.1 |
5.9 |
6.4 |
9.5 |
10.5 |
11.1 |
9.2 |
9.3 |
8.3 |
15.8 |
8.7 |
11.9 |
19.5 |
14.3 |
10.8 |
12.8 |
21.7 |
14.7 |
11.5 |
13.1 |
22.1 |
13.1 |
12.0 |
14.6 |
24.8 |
16.3 |
12.9 |
16.5 |
22.7 |
15.8 |
15.7 |
|
| Plant and machine operators and assemblers |
6.2 |
13.5 |
8.3 |
5.2 |
8.6 |
11.8 |
7.9 |
8.3 |
9.2 |
10.3 |
8.8 |
9.1 |
3.0 |
7.9 |
7.1 |
1.9 |
3.3 |
6.6 |
7.1 |
2.5 |
2.7 |
6.5 |
7.2 |
1.7 |
3.3 |
8.2 |
5.9 |
2.2 |
3.6 |
8.2 |
7.4 |
2.4 |
|
| Elementary occupations |
8.6 |
12.4 |
12.3 |
7.7 |
11.8 |
7.8 |
14.5 |
11.9 |
15.4 |
13.8 |
17.2 |
15.4 |
15.8 |
6.3 |
13.1 |
17.3 |
15.9 |
6.1 |
14.0 |
17.2 |
17.0 |
4.9 |
12.7 |
19.0 |
16.5 |
4.6 |
13.7 |
18.6 |
14.8 |
7.4 |
9.2 |
16.6 |
|
| Other/Don’t know/Not stated |
1.4 |
1.5 |
1.6 |
1.4 |
- |
- |
- |
- |
- |
- |
- |
- |
0.1 |
- |
0.2 |
0.1 |
- |
- |
- |
- |
- |
- |
- |
- |
- |
- |
- |
- |
- |
- |
- |
- |
|
| Total |
100 |
100 |
100 |
100 |
100 |
100 |
100 |
100 |
100 |
100 |
100 |
100 |
100.000013 |
100 |
99.9998643 |
99.9999835 |
100 |
100 |
100 |
100 |
100 |
100 |
100 |
100 |
100 |
100 |
100 |
100 |
100 |
100 |
100 |
100 |
|
|
| 12.
Employment population (15-64 years) by main occupation, geographical and sex
domain |
|
| Percent. |
|
| Main occupation |
2004 |
2007 |
2008 |
2009 |
2010 |
2011 |
2012 |
2013 |
|
| Cambodia |
Phnom Penh |
Other urban |
Other rural |
Cambodia |
Phnom Penh |
Other urban |
Other rural |
Cambodia |
Phnom Penh |
Other urban |
Other rural |
Cambodia |
Phnom Penh |
Other urban |
Other rural |
Cambodia |
Phnom Penh |
Other urban |
Other rural |
Cambodia |
Phnom Penh |
Other urban |
Other rural |
Cambodia |
Phnom Penh |
Other urban |
Other rural |
Cambodia |
Phnom Penh |
Other urban |
Other rural |
|
| Women |
Men |
Women |
Men |
Women |
Men |
Women |
Men |
Women |
Men |
Women |
Men |
Women |
Men |
Women |
Men |
Women |
Men |
Women |
Men |
Women |
Men |
Women |
Men |
Women |
Men |
Women |
Men |
Women |
Men |
Women |
Men |
Women |
Men |
Women |
Men |
Women |
Men |
Women |
Men |
Women |
Men |
Women |
Men |
Women |
Men |
Women |
Men |
Women |
Men |
Women |
Men |
Women |
Men |
Women |
Men |
Women |
Men |
Women |
Men |
Women |
Men |
Women |
Men |
|
| Armed forces occupations |
0.1 |
1.6 |
0.5 |
5.9 |
0.3 |
3.8 |
0.0 |
0.8 |
0.0 |
0.9 |
0.4 |
2.7 |
- |
1.9 |
- |
0.5 |
0.1 |
0.9 |
0.3 |
4.2 |
- |
2.0 |
0.0 |
0.4 |
0.1 |
1.2 |
0.6 |
4.0 |
0.0 |
2.5 |
0.0 |
0.8 |
0.1 |
1.5 |
0.2 |
3.1 |
0.1 |
2.1 |
0.1 |
1.2 |
0.1 |
1.5 |
0.4 |
5.2 |
0.2 |
2.3 |
- |
0.9 |
0.1 |
1.6 |
0.1 |
2.9 |
0.1 |
4.0 |
0.0 |
1.0 |
0.0 |
1.4 |
0.1 |
3.2 |
- |
1.4 |
0.0 |
1.2 |
|
| Manager |
0.5 |
2.1 |
3.9 |
7.6 |
0.8 |
2.9 |
0.1 |
1.3 |
0.5 |
1.2 |
0.9 |
2.5 |
2.0 |
3.3 |
0.3 |
0.8 |
0.3 |
1.3 |
1.1 |
4.0 |
1.0 |
0.5 |
0.1 |
1.0 |
0.2 |
0.8 |
0.9 |
2.2 |
0.3 |
0.8 |
0.1 |
0.7 |
0.2 |
0.9 |
1.1 |
1.8 |
0.4 |
1.2 |
0.1 |
0.7 |
0.2 |
0.9 |
0.4 |
2.5 |
0.3 |
1.0 |
0.2 |
0.7 |
0.4 |
1.0 |
1.6 |
1.2 |
0.7 |
2.1 |
0.2 |
0.8 |
0.6 |
1.2 |
0.7 |
1.3 |
0.9 |
2.3 |
0.5 |
1.0 |
|
| Professionals |
2.7 |
4.9 |
12.1 |
19.3 |
6.1 |
8.7 |
1.2 |
2.6 |
2.5 |
3.5 |
13.4 |
14.2 |
5.2 |
5.7 |
1.0 |
1.9 |
2.6 |
4.0 |
13.6 |
14.7 |
5.0 |
8.9 |
1.0 |
2.0 |
2.0 |
3.1 |
6.0 |
8.4 |
5.6 |
6.2 |
1.1 |
2.1 |
2.0 |
3.5 |
6.0 |
8.7 |
4.5 |
5.6 |
1.2 |
2.6 |
1.8 |
2.5 |
8.2 |
7.6 |
4.9 |
6.5 |
0.7 |
1.4 |
2.3 |
2.8 |
5.3 |
6.5 |
5.1 |
5.0 |
1.4 |
1.9 |
3.0 |
2.9 |
8.5 |
8.6 |
6.3 |
5.8 |
1.7 |
1.7 |
|
| Technicians and associate professionals |
0.5 |
0.8 |
3.1 |
3.8 |
0.9 |
1.7 |
0.1 |
0.3 |
1.1 |
2.9 |
5.4 |
9.8 |
2.3 |
8.8 |
0.5 |
1.3 |
1.0 |
3.4 |
4.4 |
9.3 |
2.8 |
5.9 |
0.4 |
2.4 |
0.5 |
1.2 |
2.4 |
4.9 |
1.1 |
2.1 |
0.3 |
0.7 |
0.5 |
1.2 |
2.6 |
5.4 |
1.2 |
1.5 |
0.2 |
0.7 |
0.5 |
1.0 |
2.2 |
4.4 |
1.1 |
1.5 |
0.2 |
0.5 |
0.5 |
1.4 |
1.0 |
3.5 |
1.2 |
2.5 |
0.4 |
0.9 |
0.7 |
1.1 |
1.9 |
2.3 |
1.7 |
2.3 |
0.4 |
0.7 |
|
| Clerical support workers |
0.2 |
0.2 |
1.0 |
0.9 |
0.7 |
0.2 |
0.1 |
0.1 |
1.5 |
2.3 |
8.0 |
12.5 |
2.8 |
5.5 |
0.7 |
0.7 |
1.8 |
3.1 |
8.4 |
15.9 |
3.0 |
7.2 |
0.9 |
1.0 |
1.5 |
2.4 |
9.5 |
13.0 |
2.8 |
6.4 |
0.4 |
0.7 |
1.6 |
3.2 |
9.8 |
14.8 |
2.7 |
4.8 |
0.6 |
1.6 |
1.7 |
2.9 |
10.3 |
15.0 |
4.3 |
4.8 |
0.4 |
1.1 |
2.1 |
3.0 |
8.4 |
11.4 |
5.1 |
7.0 |
0.7 |
1.2 |
2.2 |
3.7 |
9.6 |
14.1 |
5.4 |
9.6 |
0.7 |
1.3 |
|
| Service and sales workers |
18.5 |
8.7 |
43.8 |
22.6 |
32.8 |
16.0 |
13.6 |
6.1 |
17.0 |
7.3 |
46.5 |
21.3 |
35.6 |
12.8 |
11.7 |
4.9 |
14.5 |
4.9 |
41.6 |
16.7 |
27.9 |
5.8 |
9.8 |
3.3 |
19.6 |
9.8 |
50.1 |
27.3 |
41.9 |
21.7 |
13.6 |
6.3 |
22.4 |
10.9 |
45.7 |
29.0 |
47.3 |
25.9 |
16.8 |
7.0 |
19.9 |
11.4 |
42.3 |
30.5 |
47.5 |
26.0 |
13.9 |
7.0 |
21.6 |
11.1 |
47.2 |
25.9 |
48.4 |
24.5 |
13.7 |
6.8 |
22.8 |
11.2 |
44.8 |
25.4 |
53.4 |
25.3 |
15.6 |
7.1 |
|
| Skilled agricultural, forestry and fishery
workers |
58.1 |
59.4 |
0.7 |
1.3 |
35.6 |
35.2 |
67.7 |
69.5 |
52.7 |
50.1 |
0.8 |
1.3 |
28.3 |
22.9 |
61.1 |
59.4 |
47.9 |
48.0 |
0.1 |
0.6 |
23.9 |
23.0 |
56.2 |
57.0 |
47.8 |
48.1 |
2.2 |
1.4 |
19.3 |
20.3 |
56.3 |
56.9 |
44.7 |
43.5 |
1.3 |
1.7 |
16.5 |
14.1 |
52.8 |
52.0 |
44.7 |
45.3 |
2.0 |
2.0 |
17.9 |
15.3 |
52.8 |
54.8 |
42.4 |
41.0 |
4.2 |
5.4 |
12.3 |
11.0 |
52.7 |
51.1 |
41.4 |
38.2 |
1.7 |
1.5 |
12.0 |
9.6 |
51.1 |
47.7 |
|
| Craft and related worker |
6.6 |
5.5 |
9.5 |
10.6 |
5.0 |
6.9 |
6.5 |
4.8 |
6.8 |
11.8 |
7.6 |
13.0 |
5.8 |
16.9 |
6.9 |
11.1 |
7.0 |
11.5 |
5.3 |
11.3 |
8.9 |
23.8 |
6.9 |
10.0 |
13.8 |
10.0 |
21.9 |
17.1 |
15.3 |
13.3 |
12.8 |
8.8 |
13.7 |
11.8 |
27.3 |
16.7 |
15.1 |
14.3 |
12.1 |
10.9 |
15.2 |
11.1 |
30.4 |
15.1 |
13.5 |
12.7 |
13.7 |
10.3 |
15.4 |
13.9 |
26.6 |
23.1 |
14.0 |
18.4 |
14.0 |
11.9 |
16.5 |
16.6 |
26.1 |
19.7 |
12.6 |
18.9 |
15.5 |
15.8 |
|
| Plant and machine operators and assemblers |
5.8 |
6.5 |
11.2 |
15.3 |
5.7 |
11.3 |
5.2 |
4.8 |
7.5 |
9.4 |
8.6 |
15.6 |
3.8 |
10.8 |
7.7 |
8.4 |
8.8 |
9.3 |
8.8 |
11.8 |
4.3 |
12.0 |
9.3 |
8.6 |
0.5 |
5.4 |
1.2 |
14.2 |
1.0 |
13.0 |
0.4 |
3.4 |
0.5 |
6.2 |
0.3 |
12.3 |
0.6 |
14.1 |
0.5 |
4.5 |
0.3 |
5.1 |
0.2 |
11.8 |
0.7 |
14.0 |
0.3 |
3.1 |
0.3 |
6.2 |
1.0 |
15.3 |
0.1 |
11.2 |
0.2 |
4.1 |
0.6 |
6.5 |
0.4 |
15.3 |
0.6 |
13.8 |
0.6 |
4.2 |
|
| Elementary occupations |
6.7 |
10.0 |
13.9 |
11.9 |
11.5 |
12.8 |
5.2 |
9.4 |
10.3 |
10.7 |
8.3 |
7.2 |
14.2 |
11.4 |
10.2 |
11.0 |
16.0 |
13.6 |
16.3 |
11.2 |
23.1 |
10.9 |
15.2 |
14.2 |
13.9 |
17.8 |
5.2 |
7.4 |
12.5 |
13.8 |
15.0 |
19.5 |
14.4 |
17.3 |
5.7 |
6.5 |
11.8 |
16.3 |
15.7 |
18.7 |
15.6 |
18.3 |
3.8 |
5.8 |
9.6 |
15.8 |
17.7 |
20.3 |
14.9 |
18.0 |
4.4 |
4.8 |
13.0 |
14.4 |
16.7 |
20.4 |
12.2 |
17.2 |
6.1 |
8.6 |
7.1 |
11.1 |
13.8 |
19.4 |
|
| Other/Don’t know/Not stated |
0.3 |
0.3 |
0.4 |
0.8 |
0.5 |
0.4 |
0.3 |
0.3 |
0.0 |
0.0 |
- |
- |
- |
- |
0.0 |
0.0 |
0.1 |
0.1 |
0.1 |
0.4 |
- |
- |
0.1 |
0.0 |
- |
- |
- |
- |
- |
- |
- |
- |
- |
- |
- |
- |
- |
- |
- |
- |
- |
- |
- |
- |
- |
- |
- |
- |
- |
- |
- |
- |
- |
- |
- |
- |
- |
- |
- |
- |
- |
- |
- |
- |
|
| Total |
100 |
100 |
100 |
100 |
100 |
100 |
100 |
100 |
100 |
100 |
100 |
100 |
100 |
100 |
100 |
100 |
100 |
100 |
100 |
100 |
100 |
100 |
100 |
100 |
100 |
100 |
100 |
100 |
100 |
100 |
100 |
100 |
100 |
100 |
100 |
100 |
100 |
100 |
100 |
100 |
100 |
100 |
100 |
100 |
100 |
100 |
100 |
100 |
100 |
100 |
100 |
100 |
100 |
100 |
100 |
100 |
100 |
100 |
100 |
100 |
100 |
100 |
100 |
100 |
|
|
| 13.
Employed population (15-64 years) by industrial sector (main occupation) and
sex |
|
| Percent. |
|
| Industrial sector (main occupation) |
2004 |
2007 |
2008 |
2009 |
2010 |
2011 |
2012 |
2013 |
|
| Women |
Men |
Both Sexes |
Women |
Men |
Both Sexes |
Women |
Men |
Both Sexes |
Women |
Men |
Both Sexes |
Women |
Men |
Both Sexes |
Women |
Men |
Both Sexes |
Women |
Men |
Both Sexes |
Women |
Men |
Both Sexes |
|
| Employed population, (thousand) |
3,035 |
3,068 |
6,103 |
3,354 |
3,474 |
6,828 |
3,332 |
3,493 |
6,824 |
3,715 |
3,754 |
7,469 |
3,867 |
3,806 |
7,673 |
3,958 |
3,932 |
7,890 |
3,781 |
39,240 |
7,706 |
3,882 |
4,068 |
7,951 |
|
| Agriculture (Primary) |
57.1 |
57.8 |
57.4 |
59.4 |
56.1 |
57.7 |
55.5 |
55.7 |
55.6 |
57.8 |
57.4 |
57.6 |
55.4 |
52.9 |
54.2 |
56.6 |
55.0 |
55.8 |
52.8 |
49.3 |
51.0 |
50.0 |
47.4 |
48.7 |
|
| Industry (Secondary) |
14.0 |
12.6 |
13.3 |
14.3 |
15.5 |
14.9 |
15.9 |
15.7 |
15.8 |
16.2 |
15.5 |
15.9 |
15.5 |
17.0 |
16.2 |
17.5 |
16.3 |
16.9 |
18.1 |
19.0 |
18.6 |
19.2 |
20.5 |
19.9 |
|
| Services (Tertiary) |
28.6 |
29.5 |
29.1 |
26.3 |
28.4 |
27.4 |
28.6 |
28.6 |
28.6 |
26.0 |
27.0 |
26.5 |
29.1 |
30.1 |
29.6 |
26.0 |
28.7 |
27.3 |
29.1 |
31.7 |
30.4 |
30.8 |
32.1 |
31.5 |
|
| Other/Don’t know/Not stated |
0.2 |
0.1 |
0.2 |
- |
- |
- |
- |
- |
- |
- |
0.0 |
0.0 |
- |
0.1 |
0.0 |
- |
0.0 |
0.0 |
- |
0.0 |
0.0 |
- |
- |
- |
|
| Total |
100 |
100 |
100 |
100 |
100 |
100 |
100 |
100 |
100 |
100 |
100 |
100 |
100 |
100 |
100 |
100 |
100 |
100 |
100 |
100 |
100 |
100 |
100 |
100 |
|
|
| 14.
Employed population (15-64 years) by industrial sector (main occupation) and
geographical domain |
|
| Percent. |
|
| Industrial sector (main occupation) |
2004 |
2007 |
2008 |
2009 |
2010 |
2011 |
2012 |
2013 |
|
| Cambodia |
Phnom Penh |
Other urban |
Other rural |
Cambodia |
Phnom Penh |
Other urban |
Other rural |
Cambodia |
Phnom Penh |
Other urban |
Other rural |
Cambodia |
Phnom Penh |
Other urban |
Other rural |
Cambodia |
Phnom Penh |
Other urban |
Other rural |
Cambodia |
Phnom Penh |
Other urban |
Other rural |
Cambodia |
Phnom Penh |
Other urban |
Other rural |
Cambodia |
Phnom Penh |
Other urban |
Other rural |
|
| Employed population, (thousand) |
6,103 |
568 |
661 |
4,873 |
6,828 |
651 |
636 |
5,542 |
7,837 |
689 |
708 |
6,439 |
7,469 |
686 |
735 |
6,048 |
7,673 |
687 |
772 |
6,214 |
7,890 |
770 |
793 |
6,327 |
7,706 |
848 |
950 |
5,908 |
7,951 |
942 |
810 |
6,199 |
|
| Agriculture (Primary) |
57.4 |
1.1 |
35.3 |
67.0 |
57.7 |
1.1 |
30.3 |
67.5 |
58.9 |
0.5 |
31.7 |
68.1 |
57.6 |
1.9 |
24.0 |
68.0 |
54.2 |
1.6 |
19.7 |
64.3 |
55.8 |
2.2 |
21.0 |
66.7 |
51.0 |
5.2 |
16.0 |
63.2 |
48.7 |
2.0 |
13.4 |
60.4 |
|
| Industry (Secondary) |
13.3 |
17.8 |
11.8 |
12.9 |
14.9 |
13.7 |
15.1 |
15.0 |
14.6 |
13.0 |
19.1 |
14.3 |
15.9 |
21.2 |
17.8 |
15.0 |
16.2 |
23.3 |
17.8 |
15.3 |
16.9 |
24.0 |
15.4 |
16.2 |
18.6 |
24.7 |
18.9 |
17.7 |
19.9 |
25.1 |
18.8 |
19.2 |
|
| Services (Tertiary) |
29.1 |
80.9 |
52.6 |
19.9 |
27.4 |
85.1 |
54.6 |
17.5 |
26.5 |
86.5 |
49.2 |
17.6 |
26.5 |
76.9 |
58.3 |
17.0 |
29.6 |
74.9 |
62.5 |
20.5 |
27.3 |
73.7 |
63.7 |
17.1 |
30.4 |
70.1 |
65.1 |
19.1 |
31.5 |
72.9 |
67.9 |
20.4 |
|
| Other/Don’t know/Not stated |
0.2 |
0.1 |
0.3 |
0.2 |
- |
- |
- |
- |
- |
- |
- |
- |
0.0 |
- |
- |
0.0 |
0.0 |
0.2 |
0.0 |
- |
0.0 |
0.1 |
- |
- |
0.0 |
- |
- |
0.0 |
- |
- |
- |
- |
|
| Total |
100 |
100 |
100 |
100 |
100 |
100 |
100 |
100 |
100 |
100.0001 |
99.99986 |
100.000016 |
100 |
100 |
100 |
100 |
100 |
100 |
100 |
100 |
100 |
100 |
100 |
100 |
100 |
100 |
100 |
100 |
100 |
100 |
100 |
100 |
|
|
| 15.
Employed population (15-64 years) by industrial sector (main occupation),
geographical domain and sex |
|
| Percent. |
|
| Industrial sector (main occupation) |
2004 |
2007 |
2008 |
2009 |
2010 |
2011 |
2012 |
2013 |
|
| Cambodia |
Phnom Penh |
Other urban |
Other rural |
Cambodia |
Phnom Penh |
Other urban |
Other rural |
Cambodia |
Phnom Penh |
Other urban |
Other rural |
Cambodia |
Phnom Penh |
Other urban |
Other rural |
Cambodia |
Phnom Penh |
Other urban |
Other rural |
Cambodia |
Phnom Penh |
Other urban |
Other rural |
Cambodia |
Phnom Penh |
Other urban |
Other rural |
Cambodia |
Phnom Penh |
Other urban |
Other rural |
|
| Women |
Men |
Women |
Men |
Women |
Men |
Women |
Men |
Women |
Men |
Women |
Men |
Women |
Men |
Women |
Men |
Women |
Men |
Women |
Men |
Women |
Men |
Women |
Men |
Women |
Men |
Women |
Men |
Women |
Men |
Women |
Men |
Women |
Men |
Women |
Men |
Women |
Men |
Women |
Men |
Women |
Men |
Women |
Men |
Women |
Men |
Women |
Men |
Women |
Men |
Women |
Men |
Women |
Men |
Women |
Men |
Women |
Men |
Women |
Men |
Women |
Men |
Women |
Men |
|
| Employed population, (thousand) |
3,035 |
3,068 |
276 |
292 |
333 |
328 |
2,425 |
2,448 |
3,354 |
3,474 |
313 |
338 |
287 |
348 |
2,754 |
2,788 |
3,332 |
3,493 |
317 |
348 |
306 |
349 |
2,709 |
2,795 |
4,264 |
4,357 |
349 |
363 |
393 |
403 |
3,522 |
3,591 |
3,867 |
3,806 |
325 |
362 |
401 |
371 |
3,141 |
3,073 |
3,958 |
3,932 |
354 |
416 |
403 |
389 |
3,201 |
3,127 |
3,781 |
3,925 |
421 |
428 |
454 |
495 |
2,906 |
3,002 |
3,882 |
4,068 |
445 |
497 |
393 |
417 |
3,045 |
3,155 |
|
| Agriculture (Primary) |
57.1 |
57.8 |
0.6 |
1.5 |
35.7 |
34.8 |
66.5 |
67.6 |
59.4 |
56.1 |
0.9 |
1.3 |
32.7 |
28.4 |
68.8 |
66.2 |
55.5 |
55.7 |
0.2 |
0.6 |
31.9 |
28.0 |
64.6 |
66.1 |
60.4 |
61.2 |
2.7 |
1.7 |
26.0 |
26.8 |
69.9 |
71.1 |
55.4 |
52.9 |
1.2 |
1.9 |
21.8 |
17.4 |
65.3 |
63.2 |
56.6 |
55.0 |
2.1 |
2.3 |
23.4 |
18.5 |
66.8 |
66.6 |
52.8 |
49.3 |
4.7 |
5.6 |
17.6 |
14.5 |
65.2 |
61.2 |
50.0 |
47.4 |
2.3 |
1.8 |
13.9 |
12.8 |
61.7 |
59.1 |
|
| Industry (Secondary) |
14.0 |
12.6 |
20.9 |
15.0 |
12.0 |
11.7 |
13.5 |
12.4 |
14.3 |
15.5 |
15.2 |
12.3 |
10.0 |
19.3 |
14.6 |
15.4 |
15.9 |
15.7 |
14.5 |
12.0 |
14.0 |
24.0 |
16.3 |
15.1 |
15.4 |
14.2 |
21.9 |
19.6 |
17.7 |
16.5 |
14.5 |
13.3 |
15.5 |
17.0 |
28.0 |
19.1 |
16.7 |
18.9 |
14.1 |
16.5 |
17.5 |
16.3 |
31.6 |
17.5 |
14.9 |
15.8 |
16.2 |
16.2 |
18.1 |
19.0 |
28.1 |
21.3 |
16.7 |
21.0 |
16.9 |
18.4 |
19.2 |
20.5 |
27.8 |
22.7 |
16.1 |
21.3 |
18.3 |
20.1 |
|
| Services (Tertiary) |
28.6 |
29.5 |
78.3 |
83.4 |
51.8 |
53.4 |
19.8 |
19.9 |
26.3 |
28.4 |
83.9 |
86.3 |
57.3 |
52.3 |
16.5 |
18.4 |
28.6 |
28.6 |
85.3 |
87.5 |
54.1 |
47.9 |
19.1 |
18.8 |
24.2 |
24.6 |
75.4 |
78.8 |
56.3 |
56.7 |
15.6 |
15.5 |
29.1 |
30.1 |
70.9 |
78.5 |
61.6 |
63.6 |
20.6 |
20.3 |
26.0 |
28.7 |
66.3 |
80.0 |
61.7 |
65.7 |
17.0 |
17.2 |
29.1 |
31.7 |
67.2 |
73.0 |
65.7 |
64.5 |
17.9 |
20.3 |
30.8 |
32.1 |
69.9 |
75.6 |
70.0 |
65.9 |
20.0 |
20.8 |
|
| Other/Don’t know/Not stated |
0.2 |
0.1 |
0.2 |
0.1 |
0.5 |
0.1 |
0.2 |
0.2 |
- |
- |
- |
- |
- |
- |
- |
- |
- |
- |
- |
- |
- |
- |
- |
- |
- |
0.0 |
- |
- |
- |
- |
- |
0.0 |
- |
0.1 |
- |
0.5 |
- |
0.1 |
- |
- |
- |
0.0 |
- |
0.1 |
- |
- |
- |
- |
- |
0.0 |
- |
- |
- |
- |
- |
0.0 |
- |
- |
- |
- |
- |
- |
- |
- |
|
| Total |
100 |
100 |
100 |
100 |
100 |
100 |
100 |
100 |
100 |
100 |
100 |
100 |
100 |
100 |
100 |
100 |
100 |
100 |
100 |
100 |
100 |
100 |
100 |
100 |
100 |
100 |
100 |
100 |
100 |
100 |
100 |
100 |
100 |
100 |
100 |
100 |
100 |
100 |
100 |
100 |
100 |
100 |
100 |
100 |
100 |
100 |
100 |
100 |
100 |
100 |
100 |
100 |
100 |
100 |
100 |
100 |
100 |
100 |
100 |
100 |
100 |
100 |
100 |
100 |
|
|
| Table16:
Wages of unskilled workers* (5 years and above) by geographical domain |
|
| Percent. |
|
|
|
| Domain |
2004 |
2007 |
2008 |
2009 |
2010 |
2011 |
|
|
|
|
|
|
|
|
|
|
|
|
|
|
|
|
|
|
|
|
|
|
|
|
|
|
|
|
|
|
|
|
|
|
|
|
|
|
|
|
|
|
|
|
|
|
|
|
|
|
|
|
|
|
|
|
|
|
|
|
|
|
|
|
|
|
|
|
|
|
|
|
|
|
|
|
|
|
|
|
|
|
|
|
|
|
|
|
|
|
|
|
|
|
|
|
|
|
|
|
|
|
|
|
|
|
| Cambodia |
|
|
|
9.8 |
9.9 |
10.3 |
|
|
|
|
|
|
|
|
|
|
|
|
|
|
|
|
|
|
|
|
|
|
|
|
|
|
|
|
|
|
|
|
|
|
|
|
|
|
|
|
|
|
|
|
|
|
|
|
|
|
|
|
|
|
|
|
|
|
|
|
|
|
|
|
|
|
|
|
|
|
|
|
|
|
|
|
|
|
|
|
|
|
|
|
|
|
|
|
|
|
|
|
|
|
|
|
|
|
|
|
|
|
|
|
|
|
| Phnom Penh |
|
|
|
4.2 |
4.5 |
4.2 |
|
|
|
|
|
|
|
|
|
|
|
|
|
|
|
|
|
|
|
|
|
|
|
|
|
|
|
|
|
|
|
|
|
|
|
|
|
|
|
|
|
|
|
|
|
|
|
|
|
|
|
|
|
|
|
|
|
|
|
|
|
|
|
|
|
|
|
|
|
|
|
|
|
|
|
|
|
|
|
|
|
|
|
|
|
|
|
|
|
|
|
|
|
|
|
|
|
|
|
|
|
|
|
|
|
|
| Other urban |
|
|
|
8.9 |
10.4 |
9.3 |
|
|
|
|
|
|
|
|
|
|
|
|
|
|
|
|
|
|
|
|
|
|
|
|
|
|
|
|
|
|
|
|
|
|
|
|
|
|
|
|
|
|
|
|
|
|
|
|
|
|
|
|
|
|
|
|
|
|
|
|
|
|
|
|
|
|
|
|
|
|
|
|
|
|
|
|
|
|
|
|
|
|
|
|
|
|
|
|
|
|
|
|
|
|
|
|
|
|
|
|
|
|
|
|
|
|
| Other rural |
|
|
|
10.4 |
10.4 |
11.1 |
|
|
|
|
|
|
|
|
|
|
|
|
|
|
|
|
|
|
|
|
|
|
|
|
|
|
|
|
|
|
|
|
|
|
|
|
|
|
|
|
|
|
|
|
|
|
|
|
|
|
|
|
|
|
|
|
|
|
|
|
|
|
|
|
|
|
|
|
|
|
|
|
|
|
|
|
|
|
|
|
|
|
|
|
|
|
|
|
|
|
|
|
|
|
|
|
|
|
|
|
|
|
|
|
|
|
|
|
|
| * Wages of unskilled workers
are : |
|
| -CLEANERS AND HELPERS |
|
| -AGRICULTURAL,
FORESTRY AND FISHERY LABOURERS |
|
| -LABOURERS
IN MINING, CONSTRUCTION, MANUFACTURING AND TRANSPORT |
|
| -FOOD PREPARATION ASSISTANTS |
|
| -STREET
AND RELATED SALES AND SERVICE WORKERS |
|
| -REFUSE
WORKERS AND OTHER ELEMENTARY WORKERS |
|
|
| Table:
17 Working Children aged( 5-17 years ) by sex |
|
| Percent. |
|
|
|
|
|
| |
2004 |
2007 |
2008 |
2009 |
2010 |
2011 |
2012 |
2013 |
|
| Women |
Men |
Both Sexes |
Women |
Men |
Both Sexes |
Women |
Men |
Both Sexes |
Women |
Men |
Both Sexes |
Women |
Men |
Both Sexes |
Women |
Men |
Both Sexes |
Women |
Men |
Women |
Men |
Both Sexes |
|
| Working Children |
82.3 |
82.6 |
82.5 |
88.9 |
88.8 |
88.9 |
89.5 |
89.2 |
89.4 |
86.0 |
85.3 |
85.7 |
89.5 |
86.7 |
88.1 |
87.7 |
86.0 |
86.8 |
47.3 |
51.1 |
29.4 |
40.9 |
35.6 |
|
| Working Children not in School |
17.7 |
17.4 |
17.5 |
11.1 |
11.2 |
11.1 |
10.5 |
10.8 |
10.6 |
14.0 |
14.7 |
14.3 |
10.5 |
13.3 |
11.9 |
12.3 |
14.0 |
13.2 |
49.1 |
44.5 |
63.0 |
54.7 |
58.5 |
|
| Total |
100 |
100 |
100 |
100 |
100 |
100 |
100 |
100 |
100 |
100 |
100 |
100 |
100 |
100 |
100 |
100 |
100 |
100 |
100 |
100 |
100 |
100 |
100 |
|
|
| Table18:
Labour force participation rate, aged (5-17 years) by Sex and geographical
Domain |
|
| Percent. |
|
| Domain |
2004 |
2007 |
2008 |
2009 |
2010 |
2011 |
|
| Women |
Men |
Both Sexes |
Women |
Men |
Both Sexes |
Women |
Men |
Both Sexes |
Women |
Men |
Both Sexes |
Women |
Men |
Both Sexes |
Women |
Men |
Both Sexes |
|
| Cambodia |
35.4 |
35.9 |
35.6 |
38.3 |
37.7 |
38.0 |
33.8 |
36.2 |
35.0 |
37.4 |
38.8 |
38.1 |
36.9 |
36.9 |
36.9 |
35.9 |
36.4 |
36.1 |
|
| Phnom Penh |
21.2 |
12.6 |
16.9 |
11.1 |
12.3 |
11.7 |
15.7 |
8.7 |
12.3 |
13.3 |
8.1 |
10.6 |
13.2 |
6.9 |
10.0 |
7.9 |
8.7 |
8.3 |
|
| Other urban |
27.7 |
24.8 |
26.2 |
20.2 |
24.2 |
22.0 |
21.6 |
23.2 |
22.4 |
26.3 |
23.1 |
24.6 |
26.4 |
18.4 |
22.2 |
24.0 |
19.3 |
21.7 |
|
| Other rural |
37.7 |
39.3 |
38.5 |
43.5 |
41.5 |
42.4 |
37.0 |
40.2 |
38.6 |
40.9 |
43.3 |
42.1 |
40.2 |
41.7 |
40.9 |
40.3 |
41.2 |
40.7 |
|
|
|
|
|
|
|
|
|
|
|
|
|
|
|
|
|
|
|
|
|
|
|
|
|
|
|
|
|
|
|
|
|
|
|
|
|
|
|
|
|
|
|
|
|
|
|
|
|
|
|
|
|
|
|
|
|
|
|
|
|
|
|
|
|
|
|
|
|
|
|
|
|
|
|
|
|
|
|
|
|
|
|
|
|
|
|
|
|
|
|
|
|
|
|
|
|
|
|
|
|
|
|
|
|
|
|
|
|
|
|
|
|
|